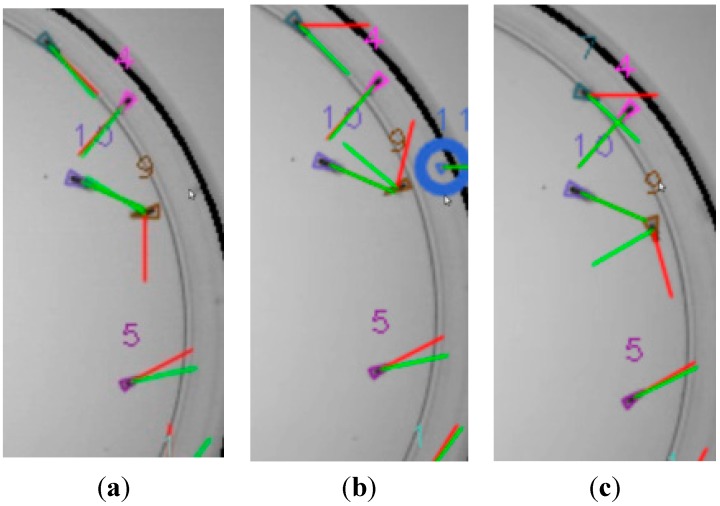
Figure 12.
Fly reflection at the plate boundary. (The instantaneous speeds, their moving average and the Kalman filter outputs are displayed red, blue and green, respectively.) Frames at t, t + 1 and t + 2, in (a–c) respectively, show that the fly reflection (encircled in blue) is correctly removed by the algorithm.

