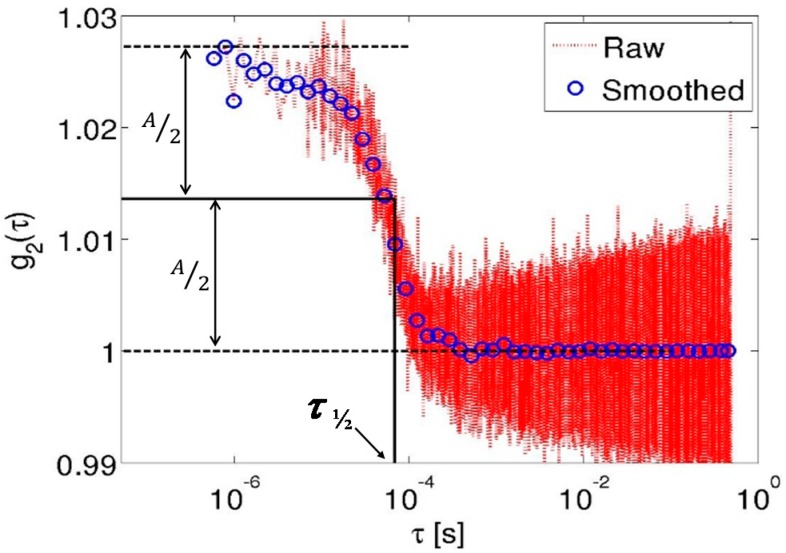
Figure 1.
The autocorrelation curve g2(τ) for a representative flow-channel experiment calculated numerically using the Fourier transform (dotted line) from the data acquired using the Raspberry Pi and its down-sampling to logarithmically, uniformly spaced points (blue circles). The amplitude, A, of g2(τ), as well as the value of τ½, are also indicated.

