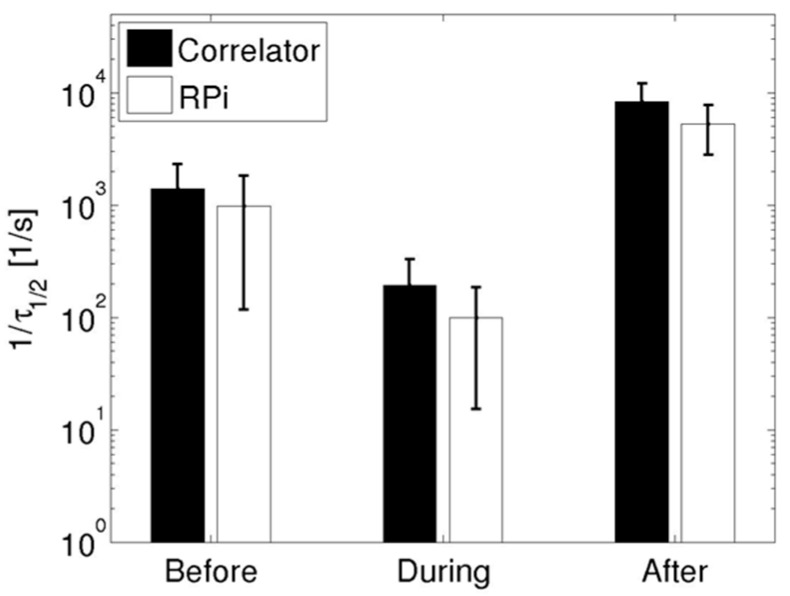
Figure 5.
Parametrized 1/τ½ values before, during, and after cuff occlusion for the in vivo experiments for data acquired using the hardware correlator (black bars) and the Raspberry Pi (white bars). The bars indicate mean values from three repeated measurements while the error bars indicate the standard deviation.

