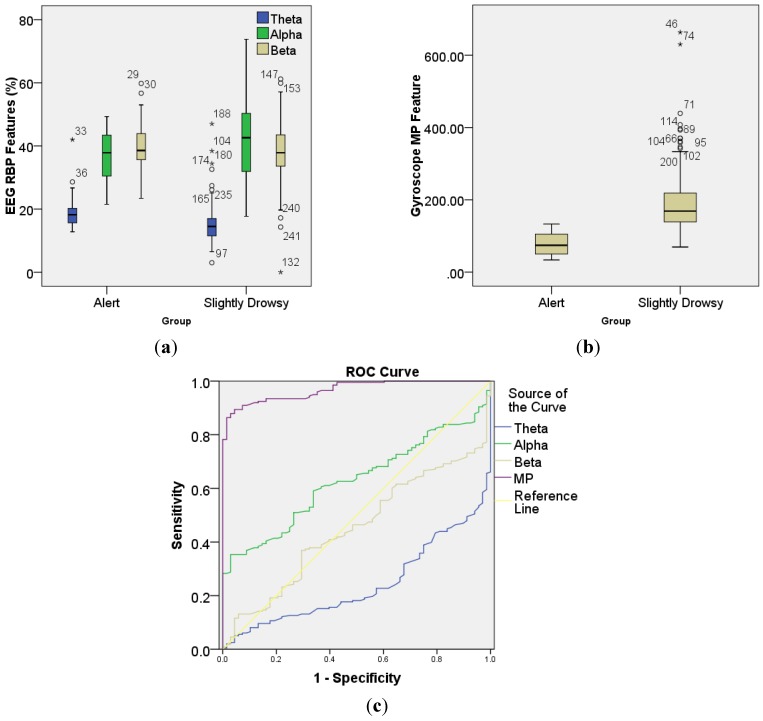
Figure 7.
Box-Whiskers plots of (a) EEG and (b) gyroscope features. The boxes have three lines to present the values for first quartile (the bottom), median, and third quartile (the top) for column data. The length between the first quartile (Q1) and the third quartile (Q3) is called interquartile range (IQR). Two addition lines at both ends of the whisker indicate the Q1 − 1.5 × IQR and Q3 + 1.5 × IQR value of a column data. Any data not included between the whiskers is plotted as outliers represented by “o” for mild outliers and “*” for extreme outliers. The number next to the outlier is the number of the data in that column, called case number; (c) ROC curve showing sensitivity (possibility of true drowsy event) and 1-specificity (possibility of false drowsy event) for extracted EEG and gyroscope features.

