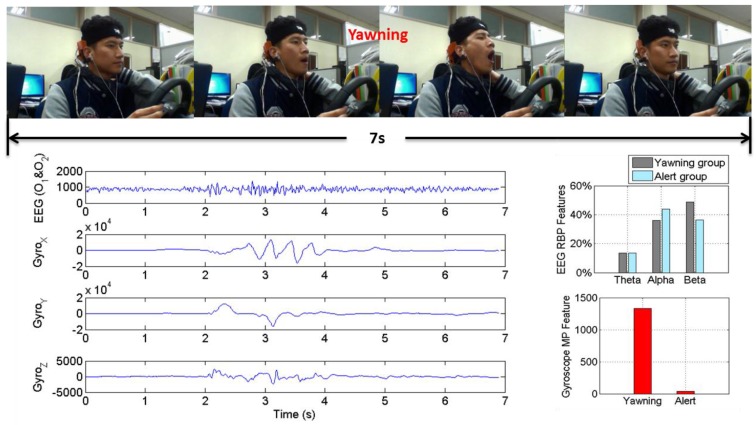
Figure 8.
The typical slightly drowsy symptom, yawning, captured by video as well as EEG and gyroscope from a representative subject. The blue line charts represent EEG raw signals, X-axis, Y-axis and Z-axis signal of the gyroscope, respectively. The two bars on the right side of the line charts represent the EEG RBP features (the top) and the gyroscope MP features (the bottom).

