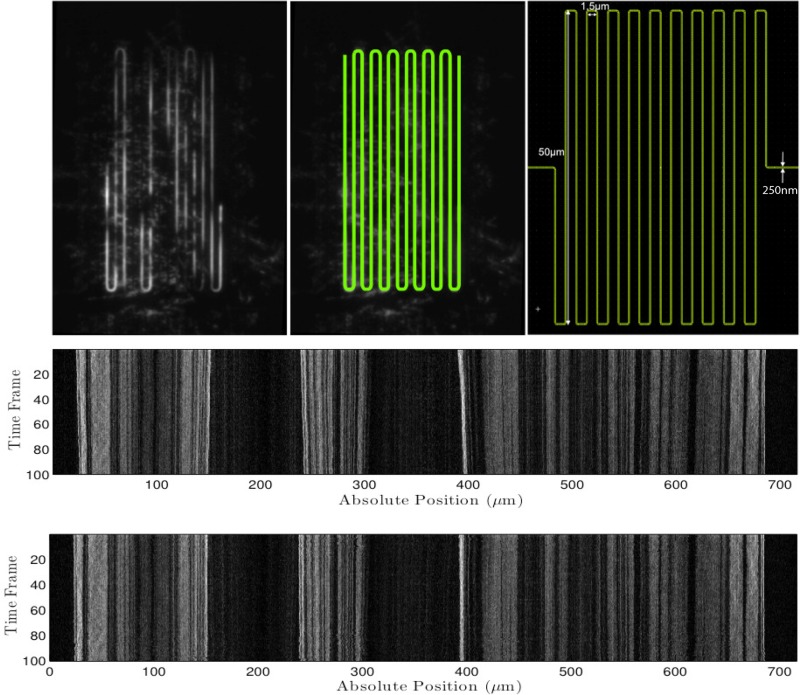
FIG. 4.
(Top, left) Time-averaged raw fluorescence intensity image of a melted S. pombe chromosome. (Top, middle) The precise location of the meandering nano-channel was found and highlighted using our meander-finding algorithm. (Top, right) Nano-lithography pattern. (Middle) Raw kymograph extracted by our tool by “walking along” the meander contour. In this procedure, a 7 pixel wide window was used in the direction perpendicular to the meander orientation. (Bottom) The alignment procedure, WPAlign, from Ref. 19 applied to the raw kymograph.

