
Fig. 1.
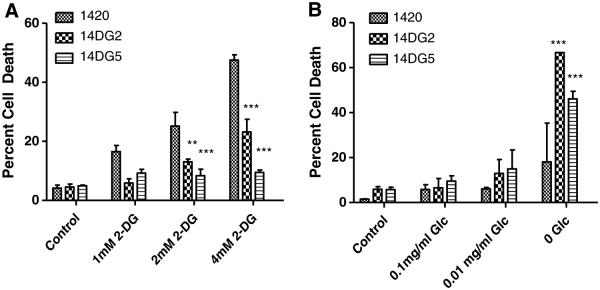
An inverse relationship between resistance to 2-DG and GS. a 1420, 14DG2 and 14DG5 cell lines were treated with the indicated doses of 2-DG for 72 h in normoxia, and percentage dead cells were assayed by trypan blue exclusion. The bars represent the average of triplicate samples ±SD. b 1420, 14DG2 and 14DG5 cell lines were challenged with the indicated levels of glucose for 72 h in normoxia, and percentage dead cells were assayed by trypan blue exclusion. The bars represent the average of triplicate samples ±SD. ***P < 0.001 and **P < 0.01, compared to 1420