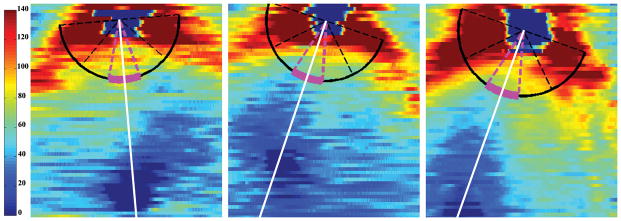
Figure 2. Retinal Nerve Layer Thickness Maps.

Retinal nerve fiber layer (RNFL) thickness maps derived from segmented spectral domain optical coherence tomography scans of three full-term, healthy infants. The organizing axis originates from the center of the optic nerve and travels through the fovea. The magenta arc denotes the papillomacular bundle, defined as the 30° arc from −15° to +15° on the axis from the optic nerve to fovea and also referred to as the 9 o’clock hour for right eyes and 3 o’clock hour for left eyes. Left, RNFL thickness map of a Black female born and imaged at 40 weeks post-menstrual age. Middle, RNFL thickness map of a White male born and imaged at 40 weeks post-menstrual age. Right, RNFL thickness map of a Hispanic female born and imaged at 38 weeks post-menstrual age.
