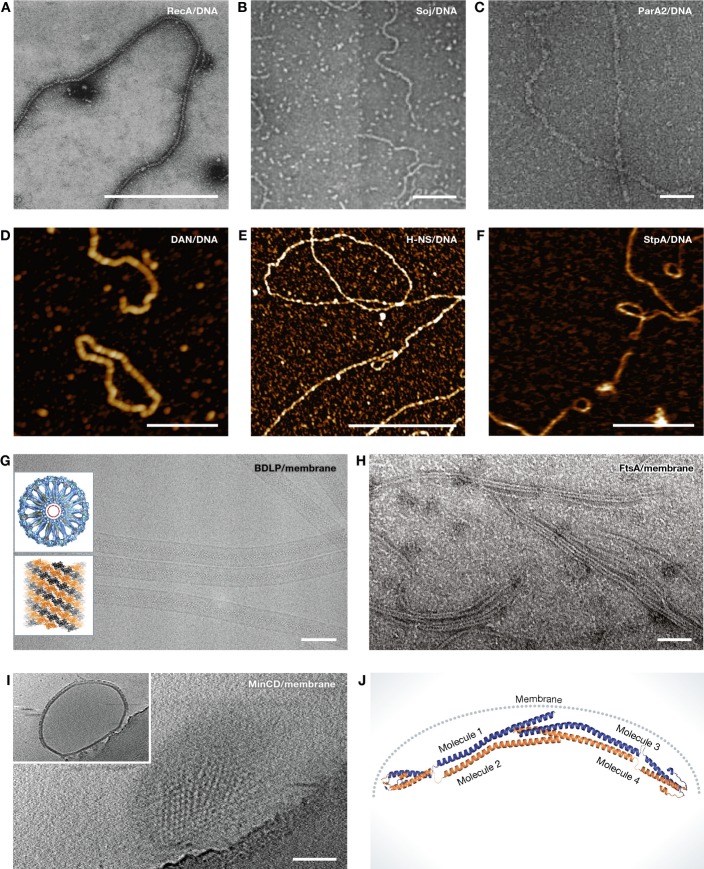
Figure 2. Different examples of collaborative filaments.
(A) RecA–ssDNA nucleoprotein filaments formed in the presence of ATP were visualised by negative staining electron microscopy (EM). Scale bar, 500 nm (reproduced with permission from Flory et al, 1984). (B) Electron micrographs of Soj–DNA collaborative filaments. These filaments are formed in the presence of ATP. Scale bar, 100 nm (reproduced with permission from Leonard et al, 2005). (C) ParA2–dsDNA nucleoprotein filaments formed in the presence of ATP and visualised by negative staining EM. Scale bar, 50 nm (reproduced with permission from Hui et al, 2010). (D) High-resolution atomic force microscopy (AFM) image showing Dan/DNA nucleoprotein filaments. Scale bar, 500 nm (reproduced with permission from Lim et al, 2013). (E) High-resolution AFM image of H-NS/DNA nucleoprotein filaments. Scale bar, 1 μm (reproduced with permission from Lim et al, 2012a). (F) H-NS paralogue StpA–DNA filaments imaged by AFM. Scale bar, 500 nm (reproduced with permission from Lim et al, 2012b). (G) Cryo-EM image of BDLP tubes. Insets showing cross section through three-dimensional reconstruction of a BDLP tube (looking along helical axis) and left-handed helical rise of BDLP filaments. Scale bar, 100 nm (reproduced with permission from Low et al, 2009). (H) Negatively stained electron micrographs of FtsA filaments formed on lipid monolayer. Scale bar, 50 nm (reproduced with permission from Szwedziak et al, 2012). (I) Electron cryotomography of MinCD copolymer-decorated liposomes. Shown is a surface view of a liposome. Inset showing additional layer formed by MinCD filaments on the liposome surface. Scale bar, 100 nm (reproduced with permission from Ghosal et al, 2014). (J) Composite model of B. subtilis DivIVA. DivIVA senses the curvature of the bacterial membrane and polymerises at specific locations (reproduced with permission from Oliva et al, 2010).

