


Figure EV2. Analysis of protein synthesis rates.
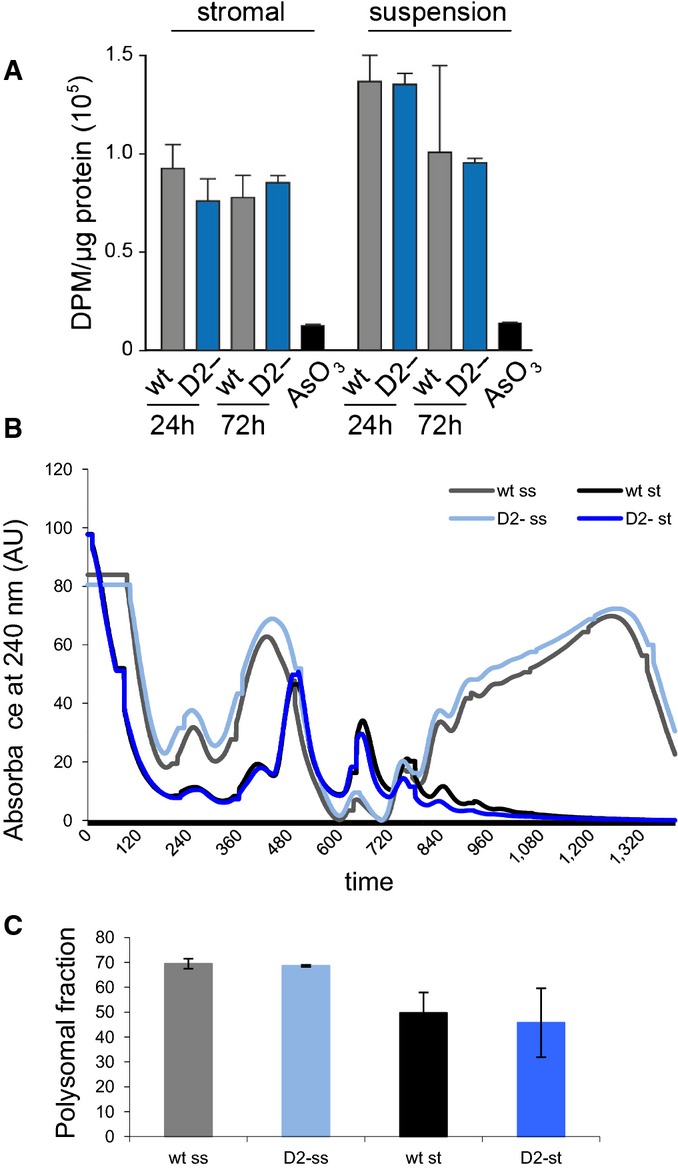
- Analysis of total protein synthesis in primary bone marrow stromal and haematopoietic cells by pulse-labeling with 3H-Gly. As a negative control, protein synthesis was blocked in wild-type cells by treatment with 250 μM sodium arsenite (AsO3). Results were obtained from three independent experiments, and error bars represent standard deviations.
- Representative polysome profiles from Dnmt2–/– and control primary bone marrow culture. Haematopoietic cells growing in suspension (ss) and attached stromal (st) cells were independently harvested and showed a higher proteins synthesis rate.
- As a measure for the global rate of translation, the fraction of polysomal ribosomes was quantified from polysome profiles. Results are shown for two independent biological replicates, and error bars represent standard deviations.