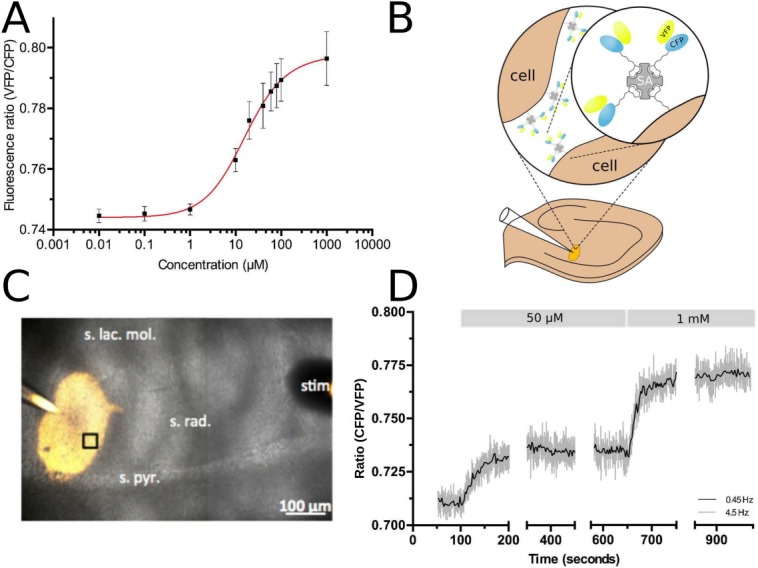
Figure 5.

Characterization and in situ testing of cpFLIPR using two-photon excitation (2PE) fluorescence microscopy. A) Calibration curve of cpFLIPR using 2PE shows a dose-dependent VFP/CFP fluorescence ratio change. Fitting the relationship between fluorescence ratio R and l-arginine concentration c with a Hill equation obtains a Kd of 14.04 ± 3.8 µM, n = 3. B) Schematic representation of sensor immobilization in brain tissue. Biotinylated cpFLIPR was conjugated to streptavidin (SA, gray) and then puffed into brain slices preincubated with EZ-link Biotin leading to its attachment to cell surfaces (brown). C) Illustrates the puff of cpFLIPR (yellow) into the striatum radiatum of the CA1 region of a rat hippocampal slice at a depth of ∼70 µm. The highlighted region was subsequently imaged at a depth of 59 µm. D) cpFLIPR responses to application of l-arginine in situ demonstrate its capability to measure steady state conditions and sensitivity to changes in ligand concentration in organized brain tissues. Fluorescence ratios at rest and after application of 50 µM and 1 mM of l-arginine were used to calculate the resting l-arginine concentration in acute brain slices.
