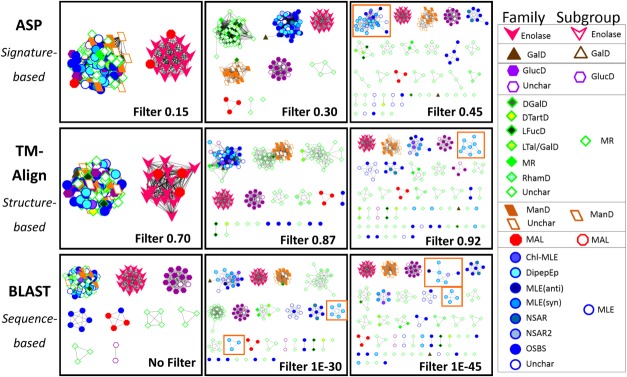
Figure 3.

Representative signature-, structure-, and sequence-based network series for the enolase superfamily. The signature-, structure-, and sequence-based networks are shown at the top, middle, and bottom of the figure, respectively. From left to right, increasingly stringent edge thresholds for each network type, resulting in clusters that share more similarity (with similarity defined based on the edge metric). SFLD subgroup designations are indicated with both node shape and node border color, and the SFLD family designations are indicated with node fill color according to the legend. Filter levels (or edge thresholds) for each network were chosen in a qualitative fashion such that the number and size of protein clusters were relatively consistent between the three networks for a superfamily. More comprehensive networks for all four superfamilies are presented in Supporting Information Figures 1 to 4. The meaning of “no filter” for the initial sequence-based network is described in Supporting Information Figure 5.
