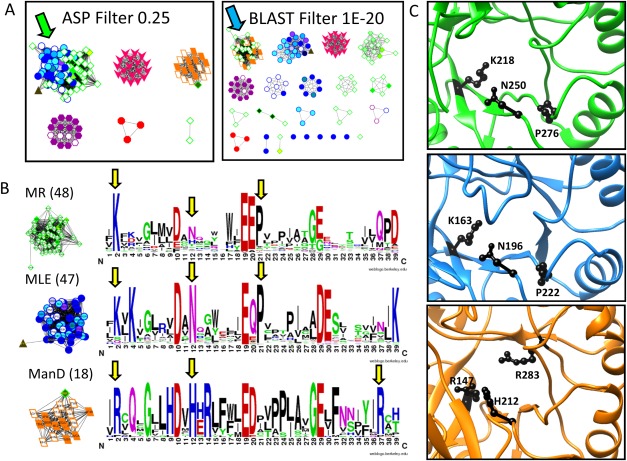
Figure 4.
Analysis of the ASPs identifies why MR, MLE, and ManD proteins cluster differently in signature- and sequence-based networks. A. In the signature-based network (A, left) the MR (green diamond) and MLE (blue circle) subgroups cluster together at the 0.25 edge threshold (green arrow) while the ManD subgroup (orange parallelogram) is a distinct subnetwork. Conversely, in the sequence-based network (A, right), the MR and ManD subgroups cluster together at the 1E-20 edge threshold (blue arrow) while MLE proteins fall in different subnetworks. B. Signature logos of the MR, MLE, and ManD signature-based subnetworks (edge threshold 0.30) show similarities and differences within the subgroup active sites (yellow arrows). C. Structures of the MR, MLE, and ManD active sites (top to bottom) shown in PDBs 2HNE, 1NU5, and 2QJJ, respectively. The residues highlighted with yellow arrows in B are represented with black side chains in the structures.

