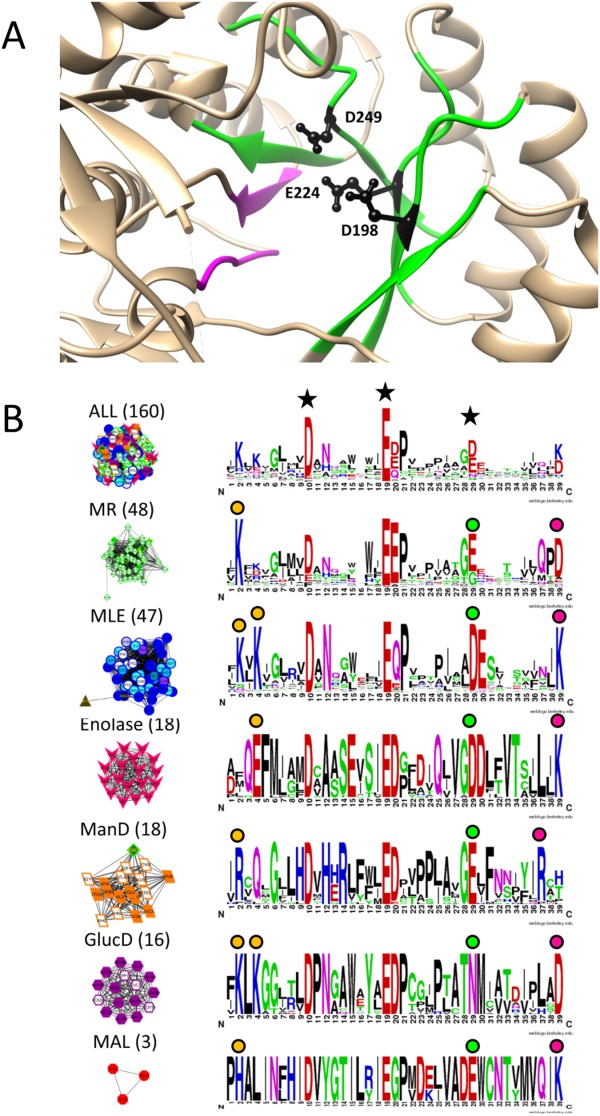
Figure 6.

Signature logos highlight residues known to be functionally important in the enolase superfamily. A. Green ribbons represent regions included in the active site signature (β2–β6) and magenta ribbons represent β7 and β8 which are not included in the active site signature but were analyzed by Rakus et al.36 Tan areas represent the remaining protein structure. The three key residues defining the active site region (black side chains) are located on strands β3, β4, and β5, respectively. B. Signature logos were created for the entire enolase superfamily (top) and the six major groups identified as signature-based subnetworks at edge score threshold of 0.30, a cutoff chosen to correlate with the SFLD subgroups [see Fig. 2(A) and Supporting Information Fig. 2 for the network series]. Node color is based on SFLD subgroup and family designation (color key in Fig. 2). Clusters are labeled with the dominant subgroup and the number of proteins in the cluster. The key residues used to create active site signatures are labeled with black stars in the top signature logo. Functionally relevant residues in each subgroup at the ends of β2, β5, and β6 as reported by Rakus et al. are identified with orange circles, green circles, and fuchsia circles, respectively. The residues in positions 10 (Asp) and 19 (Glu) of the figure were invariant throughout the superfamily and, therefore, not labeled with colored circles in each subgroup. Note that the MAL subgroup only contains three nonredundant structures so signature conservation analysis in this subgroup should be considered preliminary. Representative examples of the orange, green, and fuchsia conserved residues, respectively, in each subgroup are the following: MR (1MDR)—K164, E247, D270; MLE (1BKH)—K167, K169, D249, K273; enolase (1E9I)—E167, D316, K341; ManD (2QJJ)—R147, E262, R283; GlucD (1BQG)—K211, K213, N295, D319; MAL (1KD0)—H194, D307, K331.
