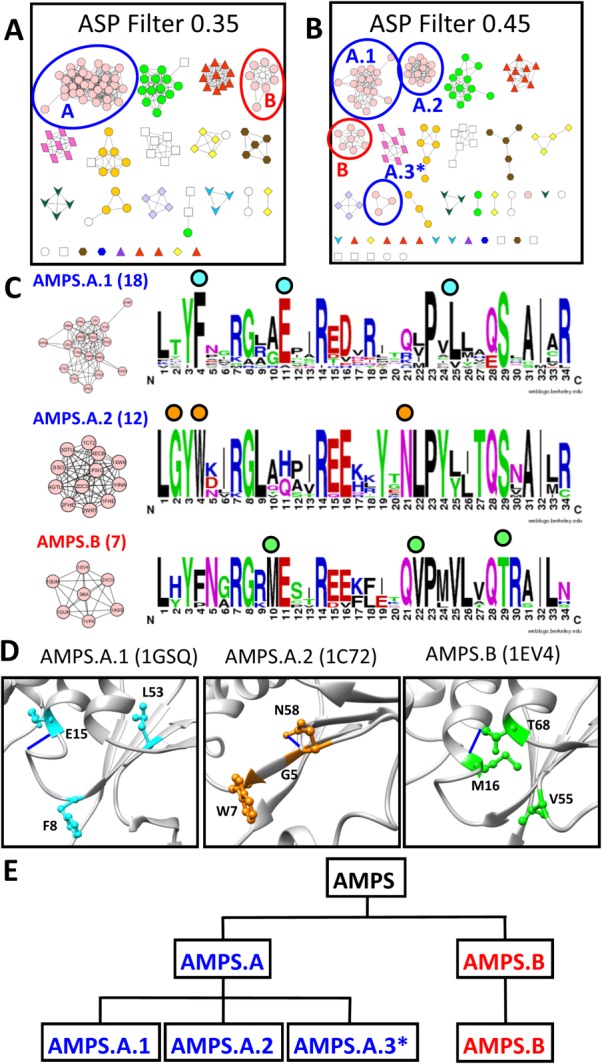
Figure 8.

AMPS subgroup signature-based clustering suggests hierarchical organization of function. A. At the 0.35 edge threshold in the signature-based network, the AMPS subgroups splits into two distinct clusters; A (blue circle) and B (red circle). B. At the 0.45 edge threshold in the signature-based network, the AMPS.A cluster splits into three smaller clusters (blue circles) while the AMPS.B cluster only loses one protein (red circle). C. Signature logos were created for the three largest AMPS clusters at edge threshold 0.45 of the signature-based GST network. Clusters are labeled with the number of proteins comprising the cluster. Colored circles above the logos indicate residues, represented with similar-colored side chains in D, conserved within a subnetwork but not conserved throughout the entire subgroup. D. Residues distinctly conserved within the AMPS.A.1, AMPS.A.2, and AMPS.B subnetworks are mapped onto representatives from each cluster (1GSQ—cyan, 1C72—orange, 1EV4—green, respectively). E. A functional hierarchy for the AMPS subgroup is defined from the signature-based network clustering. AMPS.A and AMPS.B are the two main AMPS clusters at a 0.35 edge threshold. At the 0.45 edge threshold, the AMPS.A cluster breaks into three smaller clusters while the AMPS.B cluster remains mostly the same. *The cluster is too small for detailed active site analysis.
