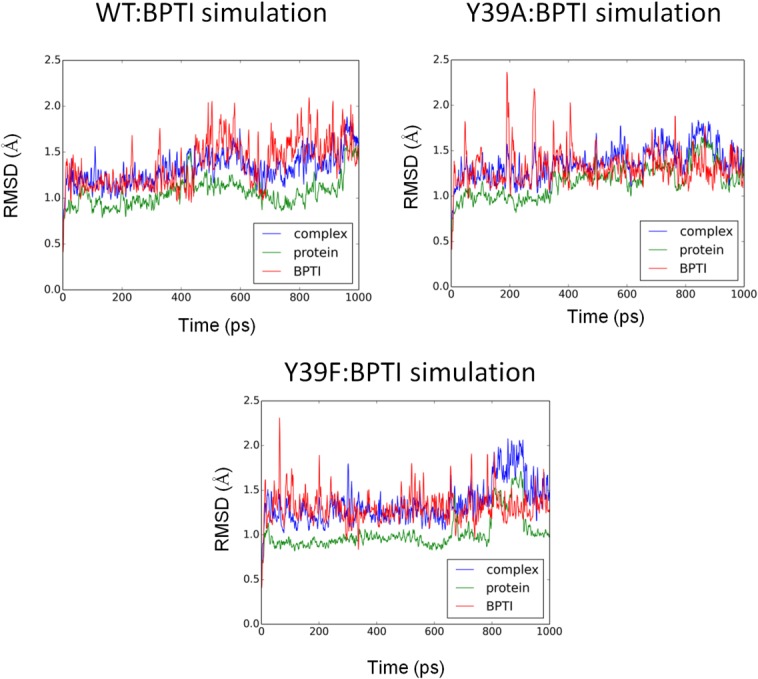
Figure 4.

The evolution of the RMSD values from the crystal coordinates as a function of the simulation time for the complex, protein and BPTI of the WT:BPTI, Y39A:BPTI, and Y39F:BPTI structures. The average values for the WT:BPTI simulations: complex 1.32 ± 0.20 Å, protein 1.06 ± 0.17 Å, and 1.37 ± 0.28 Å, for the Y39A:BPTI simulations: complex 1.37 ± 0.19 Å, protein 1.16 ± 0.18 Å, and 1.32 ± 0.23 Å and for the Y39F:BPTI simulations: complex 1.35 ± 0.25 Å, protein 1.02 ± 0.18 Å, and 1.31 ± 0.21 Å.
