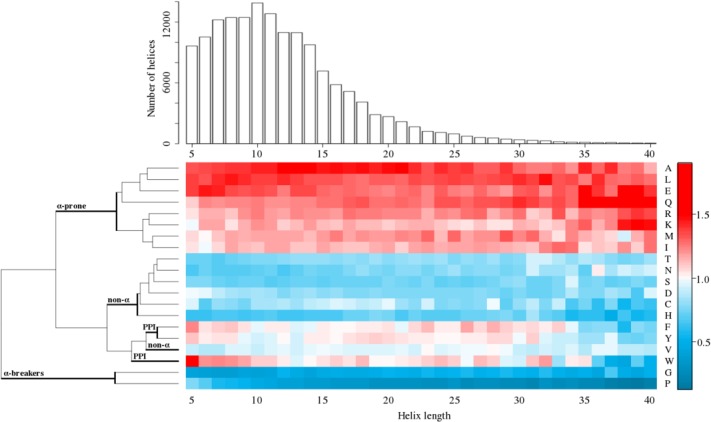
Figure 2.

Amino acid compositional bias of α-helices depending on the helix size. Distribution of helices' sizes is mostly located in the interval 5–40 residues, with the maximum at 10 residues. Compositional bias clearly separates group of amino acids in the predictor from others, showing that predictor's amino acids are preferred in helices of all sizes (see also Supplementary Fig. S2). Groups of amino acids with high/low α-helical propensity (α-prone/non-α), of potentially involved into recognition, function, and protein–protein interactions aromatic residues (PPI), as well as Gly and Pro (α-brakers) are bold-marked.
