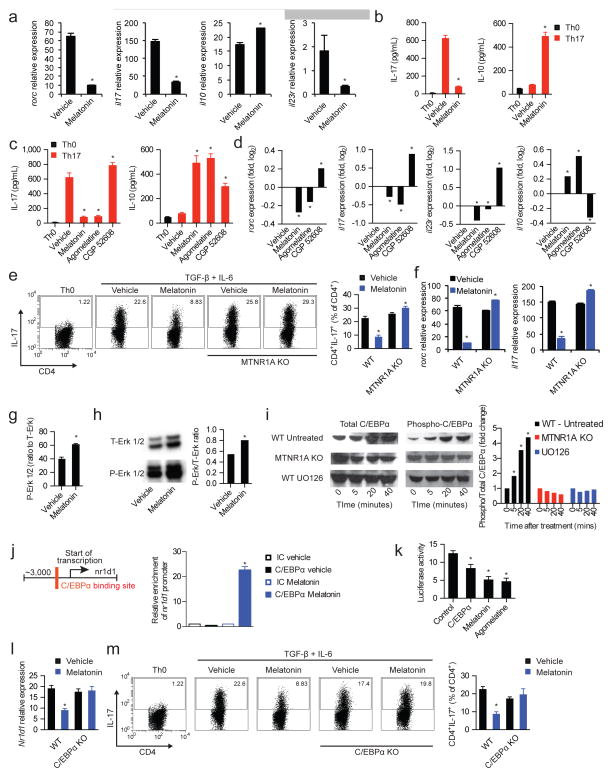
Figure 4. Melatonin interferes with Th17 cell differentiation via the Erk1/2-C/EBPα pathway.
(a) CD4+ naïve T cells were differentiated into Th17 cells by the addition of TFG-β, IL-6 (0 h) and IL-23 (48hs) in the presence or absence of melatonin (2ng/ml) and analyzed by RT-PCR after 72hs. Displayed image is representative of five experiments. * P<0.05 of unpaired T-test (b) Cytokine secretion analysis of IL-17 and IL-10 after 72hs of culture as in a. Data are representative of three independent experiments (means and s.e.m.)* P<0.05 of unpaired T-test (c) Cytokine secretion in Th17 differentiated CD4+ T cells in the presence or absence of melatonin (2ng/ml), agomelatine (20ng/ml, MTNR1A ligand) and CGP 52608 (20ng/ml, ROR-α ligand). Data are representative of three independent experiments (means and s.e.m.). * P<0.05 of one-way ANOVA. (d) RT-PCR analysis of Th17 cells cultured as in c. Data are representative of three independent experiments (means and s.e.m.). * P<0.05 of one-way ANOVA. (e) Flow cytometry analysis of IL-17 expression as in a, in wild type mice and MTNR1A-deficient mice. Data are representative of three independent experiments (means and s.e.m.) * P<0.05 of unpaired T-test. (f) Quantitative PCR analysis of wild type and MTNR1A deficient mice cultured as in e. Data are representative of three independent experiments (means and s.e.m.)* P<0.05 of unpaired T-test. (g) Signal transduction profiling using reverse protein arrays. Data are representative of two independent experiments (means and s.e.m.)* P<0.05 of unpaired T-test. (h) Immunoblot analysis of T- and P-Erk1/2. Data are representative of two independent experiments (means and s.e.m.). (i) Immunoblot analysis of T- and P-C/EBPα Data are representative of two independent experiments (means and s.e.m.). (j) Putative binding sites of C/EBPα in nr1d1 (left panel); chromatin immunoprecipitation with anti-C/EBPα (right panel). Data are representative of three independent experiments (means and s.e.m.) * P<0.05 of one-way ANOVA. (k) Luciferase activity of HEK-293 cells transfected with a luciferase reporter construct for the nr1d1 promoter. Data are representative of three independent experiments (means and s.e.m.)* P<0.05 of unpaired T-test. (l) Flow cytometry analysis of IL-17 expression as in a, in wild type mice and C/EBPα-deficient mice. Data are representative of two independent experiments (means and s.e.m.) * P<0.05 of one-way ANOVA. See also Fig. S3–S4

