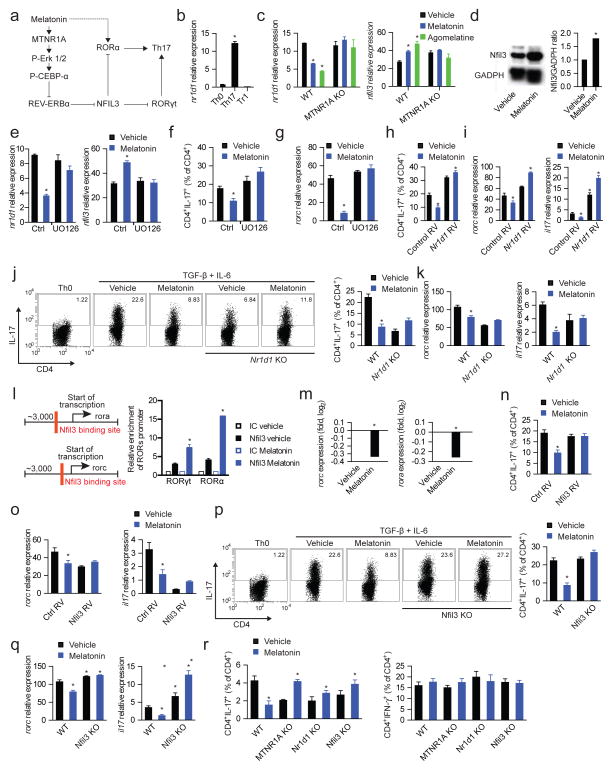
Figure 5. Melatonin interferes with Th17 cell differentiation by limiting NFIL3 expression.
(a) Schematic diagram of the proposed mechanisms mediating the effects of melatonin on Th17 cell differentiation. (b) RT-PCR analysis of nr1d1 expression in CD4+ T cells activated under Th0, Th17 and Tr1 polarizing conditions for 3 days. Data are representative of three independent experiments (means and s.e.m.). * P<0.05 of unpaired T-test. (c) RT-PCR analysis of nr1d1 (left panel) and nfil3 (right panel) expression in CD4+ T cells activated under Th17 polarizing conditions for 3 days treated with vehicle, melatonin (2ng/ml) or agomelatine 20ng/ml). Data are representative of three independent experiments (means and s.e.m.). * P<0.05 of unpaired T-test. NFIL3 expression was further confirmed by western blot (d) Data are representative of two independent experiments (means and s.e.m.). (e) RT-PCR analysis of nfil3 expression in CD4+ T cells activated under Th17 polarizing conditions for 3 days in the presence of melatonin (2ng/ml) and/or UO126. Data are representative of five independent experiments (means and s.e.m.). * P<0.05 of one-way ANOVA. (f,g) Flow cytometry analysis of IL-17 expression (f) and rorc expression (g) in CD4+ T cells activated under Th17 polarizing conditions in the presence of melatonin (2ng/ml) and/or UO126. Data are representative of three independent experiments (means and s.e.m.) * P<0.05 of one-way ANOVA. (h,i) Flow cytometry analysis of IL-17 expression (h) and rorc and il17 expression (i) in CD4+ T cells activated under Th17 polarizing conditions in the presence of melatonin (2ng/ml), following infecting with a control or an nr1d1-encoding retrovirus. Data are representative of three independent experiments (means and s.e.m.) * P<0.05 of one-way ANOVA. (j,k) Flow cytometry analysis of IL-17 expression (j) and rorc and il17 expression (k) ) in wild type and REV-ERBα deficient CD4+ T cells activated under Th17 polarizing conditions in the presence of melatonin (2ng/ml). Data are representative of three independent experiments (means and s.e.m.) * P<0.05 of one-way ANOVA. (l) Putative binding sites of Nfil3 in rorc and rora (left panel); ChIP analysis of the interaction of NFIL3 with its putative binding sites in CD4+ T cells activated under Th17 polarizing conditions (right panel). Data are representative of three independent experiments (means and s.e.m.) * P<0.05 of one-way ANOVA. (m) RT-PCR analysis of rorc and rora expression in CD4+ T cells activated under Th17 polarizing conditions in the presence of melatonin (2ng/ml). Data are representative of three independent experiments (means and s.e.m.) * P<0.05 of unpaired T-test. (n,o) Flow cytometry analysis of IL-17 expression (n) and rorc and il17 expression (o) in CD4+ T cells activated under Th17 polarizing conditions in the presence of melatonin (2ng/ml) and transduced with a control or nfil3-encoding retrovirus. Data are representative of three independent experiments (means and s.e.m.) * P<0.05 of one-way ANOVA. (p,q) Flow cytometry analysis of IL-17 expression (p) and rorc and il17 expression (q) in wild type mice and NFIL3-deficient in CD4+ T cells activated under Th17 polarizing conditions in the presence of melatonin (2ng/ml). Data are representative of three independent experiments (means and s.e.m.) * P<0.05 of one-way ANOVA. (r) Flow cytometry analysis of IL-17 and IFN-γ expression in CD4+ T cells from RAG-1 deficient mice reconstituted with wild type, MTNR1A-REV-ERBα or NFIL3-deficient CD4+ T cells, immunized with MOG35-55 in CFA and treated with vehicle or melatonin (5mg/kg). *P<0.05 of unpaired T-test. See also Fig. S5

