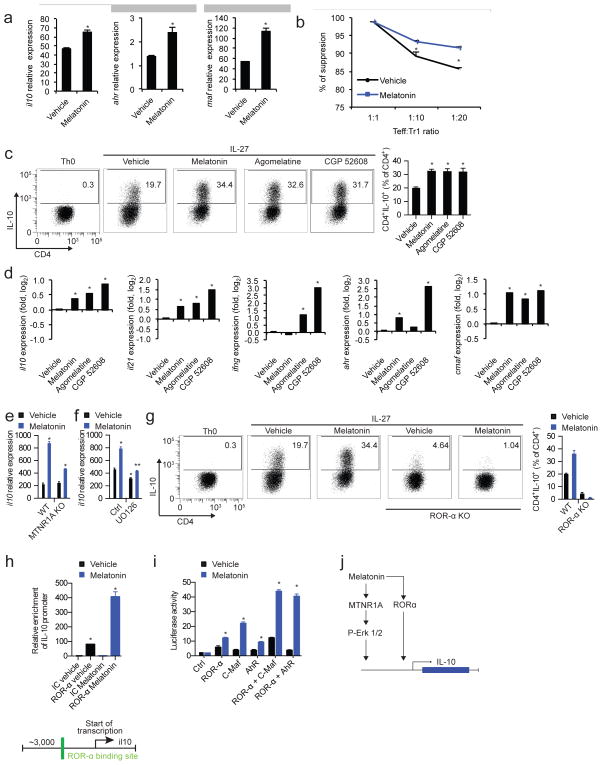
Figure 6. Melatonin boosts Tr1 cell differentiation.
(a) RT-PCR analysis of il10, ahr and maf expression in Tr1 differentiated CD4+ T cells in the presence or absence of melatonin (2ng/ml). Data are representative of three independent experiments (means and s.e.m.). * P<0.05 of one-way ANOVA (b) In vitro suppression assay, treated or untreated differentiated Tr1 cells as in a, were co-cultured after 72hs with CD4+ T cells previously labeled with CSFE, and proliferation cycles (CSFE dilution) were measured after 48hs by flow cytometry. Data are representative of two independent experiments (means and s.e.m.) * P<0.05 of one-way ANOVA. (c) Flow cytometry analysis of IL-10 expression in Tr1 differentiated CD4+ T cells in the presence or absence of melatonin (2ng/ml), agomelatine (20ng/ml, MTNR1A ligand) and CGP 52608 (20ng/ml, ROR-α ligand). Data are representative of three independent experiments (means and s.e.m.) * P<0.05 of one-way ANOVA. (d) RT-PCR analysis of Tr1 cells cultured as in c. Data are representative of three independent experiments (means and s.e.m.) * P<0.05 of one-way ANOVA. (e) RT-PCR analysis of il10 expression as in c, in wild type mice and MTNR1A deficient mice. Data are representative of three independent experiments (means and s.e.m.) * P<0.05 of one-way ANOVA. (f) RT-PCR expression of il10 in melatonin treated Tr1 cells with or without the addition of UO126. Data are representative of five independent experiments (means and s.e.m.). * P<0.05 of unpaired T-test vs vehicle and signaling inhibitor control condition. ** P<0.05 vs vehicle of UO126-treated condition. (g) Flow cytometry analysis of IL-10 expression as in c, in wild type mice and ROR-α deficient mice. (h) ROR-α putative binding site present in the il10 promoter (lower panel), and chromatin immunoprecipitation with anti-ROR-α (upper panel) Data are representative of three independent experiments (means and s.e.m.). * P<0.05 of unpaired T-test. (i) Luciferase activity of HEK-293 cells transfected with a luciferase reporter construct for the il10 promoter. Data are representative of three independent experiments (means and s.e.m.)* P<0.05 of unpaired T-test. (j) Schematic diagram depicting the effects of melatonin in Tr1 cells.

