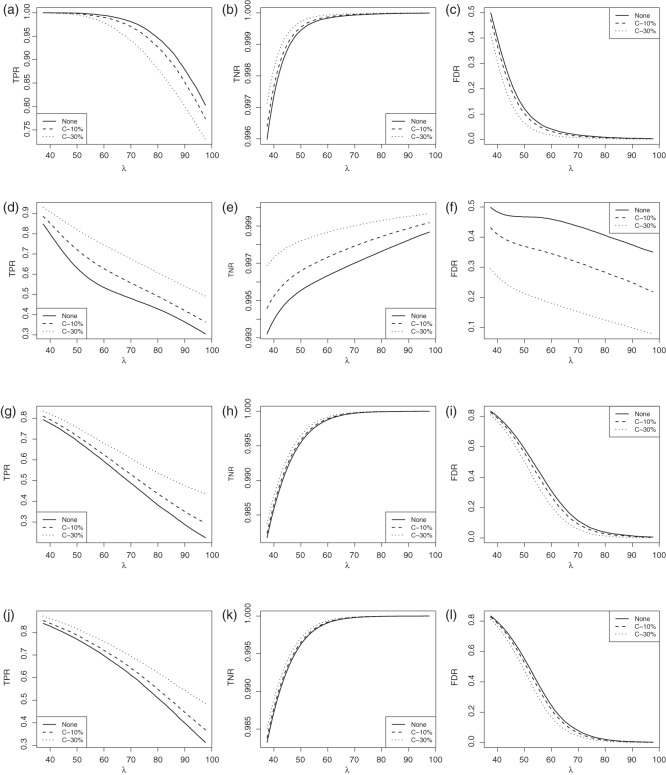
Fig. 2.
The averages of TPR, TNR, and FDR for (N1)–(N4) networks in Figure 1 with  and
and  . “None”, “C-10%”, and “C-30%” denote the SPACE method (solid), the SCPG method with 10% (dashed) and 30% (dotted) partially identified edges, respectively. (a) (N1) TPR
 , (b) (N1) TNR
 , (c) (N1) FDR
 , (d) (N2) TPR
 , (e) (N2) TNR
 , (f) (N2) FDR
 , (g) (N3) TPR
 , (h) (N3) TNR
 , (i) (N3) FDR
 , (j) (N4) TPR
 , (k) (N4) TNR
 , and (l) (N4) FDR
 .
.

