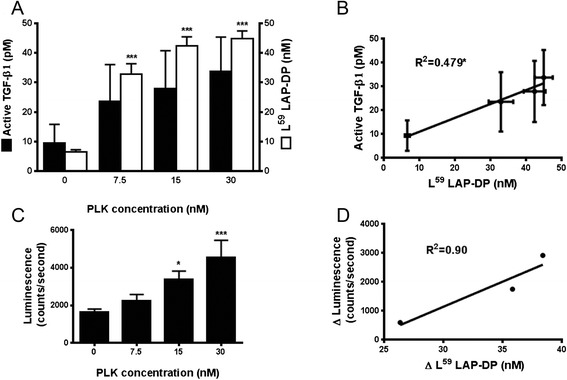
Fig. 2.

Correlation among L59 LAP-DPs and active TGF-β in the culture medium, and intracellular signal transduction. a, c The ×9CAGA-Luc-transformed CCL64 cells were cultured in PLK-added CM derived from HEK293T cells overexpressing hLTGF-β1. After 6 h, the levels of active TGF-β1 and L59 LAP-DPs were determined by respective ELISAs (a), and the extent of TGF-β signaling was measured by luciferase activity in CCL64 cells (c). b, d The scatterplots between the levels of L59 LAP-DPs and active TGF-β shown in a (b) and between increases in L59 LAP-DP levels and increases in luminescence from the values obtained compared to basal levels in the absence of PLK shown in c (d). A significant positive correlation was seen (b) *p-value <0.05, ***p-value <0.001 obtained comparing to 0
