
Figure 4.
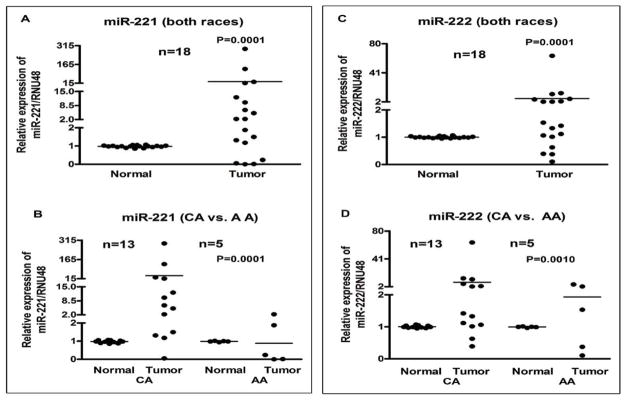
Comparative expression analysis of miR-221 and miR-222 in 18 paired samples of FFPE cell blocks of tumor and normal tissue from PTC patients’ individually using qRT-PCR. Combined data for both races (A and C) and race-specific data (B and D) is presented. For miR-221, there appears to be greater up-regulation in CA tumors than in AA tumors (4B). No such race-specific difference was observed for miR-222. The miRNAs expression was normalized using RNU48 miRNA. P values represent comparison between normal and tumor (4A, 4C), and CA tumor vs AA tumor (4B, 4D) using F test.