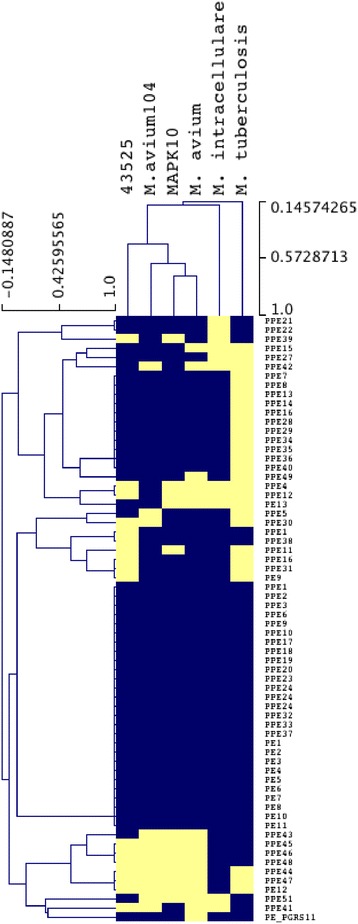
Fig. 3.

A summary of the presence and absence of the MACPE/PPE. The genes were sorted according to their distribution profiles (Additional file 1). Orthologues in M. tuberculosis were also added for comparison. Blue indicates the gene (listed on the right hand side) is present while yellow indicates the gene is missing. The strain order across the top is determined by the relative presence/absence of PE/PPE genes
