
Fig. 1.
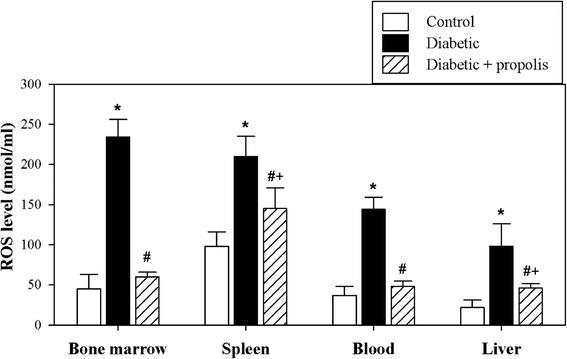
Significant alterations in the levels of ROS in different organs of diabetic mice after supplementation with propolis. The levels of ROS were determined in control mice (open bars), diabetic mice (black bars) and propolis-treated diabetic mice (hatched bars) as described in the Materials and Methods section. The pooled data for 10 mice from each group are expressed as the mean ROS level ± SEM. * P < 0.05 for diabetic versus control; # P < 0.05 for diabetic + propolis versus diabetic; + P < 0.05 for diabetic + propolis versus control (ANOVA followed by Tukey’s post-test)