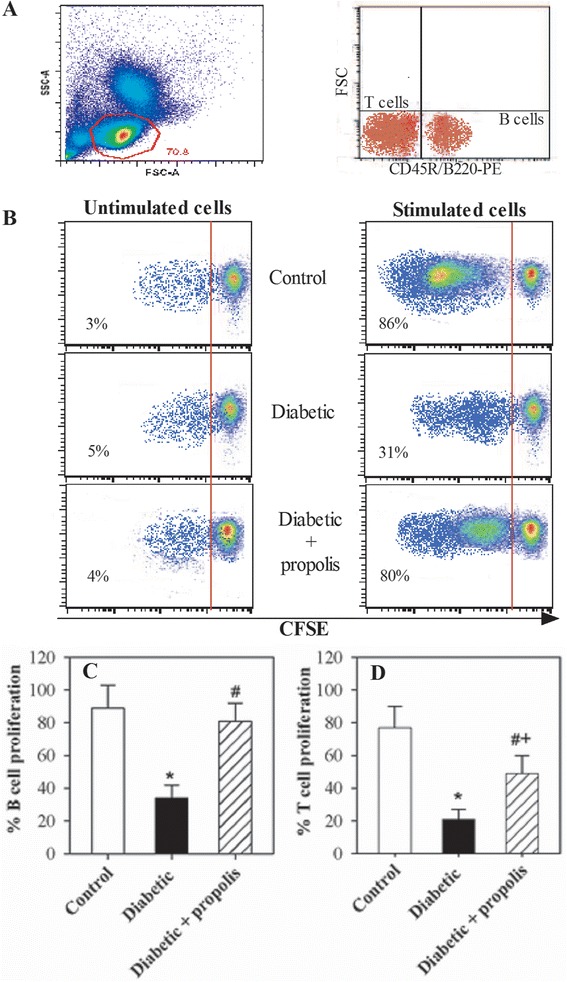
Fig. 3.

Altered proliferative capacity of B and T lymphocytes in diabetic mice supplemented with propolis. The proliferative capacity of B lymphocytes in response to stimulation with IL-4 and CD40L and of T lymphocytes in response to stimulation with SEB was evaluated using CFSE assays and flow cytometry. a Representative dot plots showing the gating strategy to obtain viable lymphocytes based on forward and side scatter and to discriminate between the CD45R/B220+ cell population (B-lymphocytes) and the CD45R/B220neg cell population (T-lymphocytes) using an CD45R/B220-PE mAb and flow cytometric analysis. b One representative experiment showing the analysis of CFSE-stained B cells (after gating for viable cells); the percentage of proliferating cells (CFSE-lo) in control, diabetic and propolis-treated diabetic mice is indicated in each panel. c & d The data from the different experiments (n = 10) are expressed as the mean percentage of proliferating cells ± SEM in response to stimulation either with IL-4 and CD40L or with SEB in control mice (open bars), diabetic mice (black bars), or propolis-treated diabetic mice (hatched bars). * P < 0.05 for diabetic versus control; # P < 0.05 for diabetic + propolis versus diabetic; + P < 0.05 for diabetic + propolis versus control (ANOVA followed by Tukey’s post-test)
