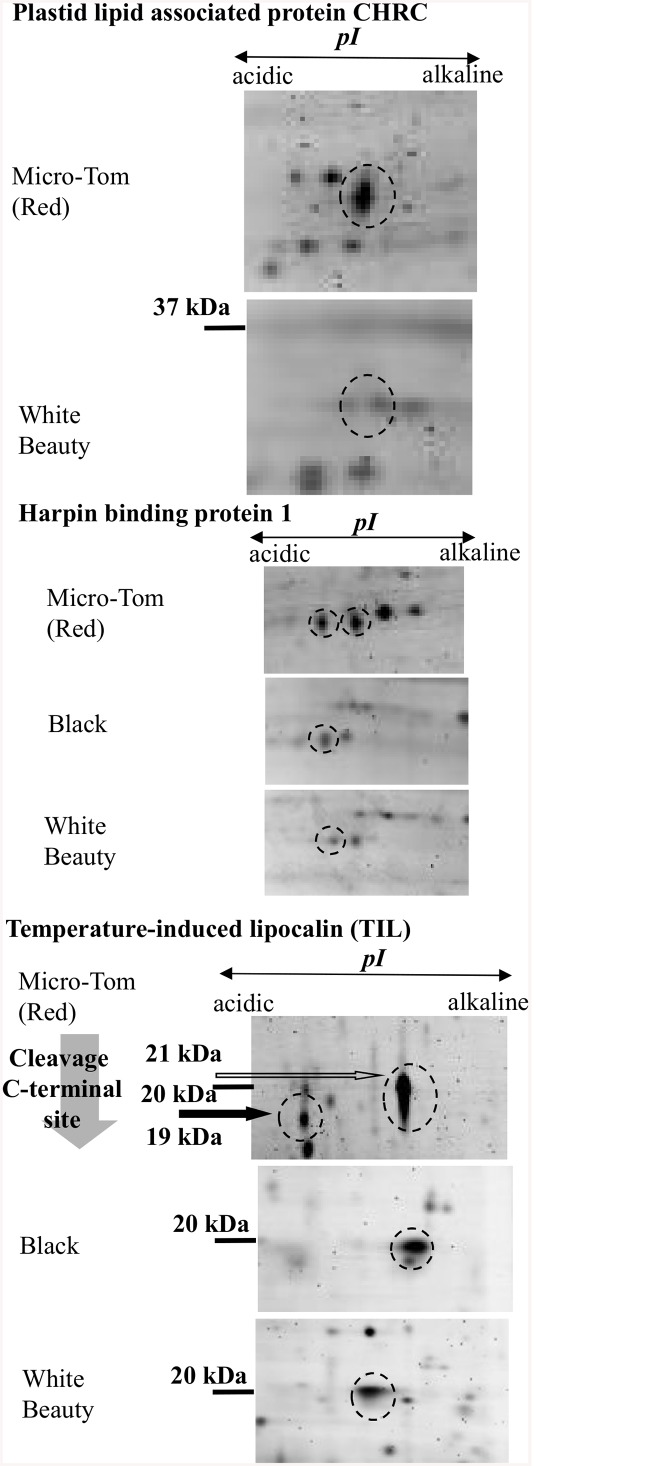
Fig 6. Proteins of varying levels of accumulation in ‘Micro-Tom’ (Red), ‘Black’ and ‘White Beauty’.
Enlarged images of 2D-PAGE results from Fig 5 that showed significant differences in protein accumulation. Protein spots of note are indicated with broken line circles. CHRC: ‘Micro-Tom’ spot16, ‘White Beauty’ spot16, HrBP1: ‘Micro-Tom’ spots17 and 18, ‘Black’ spot13, ‘White Beauty’ spot14, TIL: ‘Micro-Tom’ spots27 and 28, ‘Black’ spot 21, ‘White Beauty’ spot25.

