
Fig. 3.
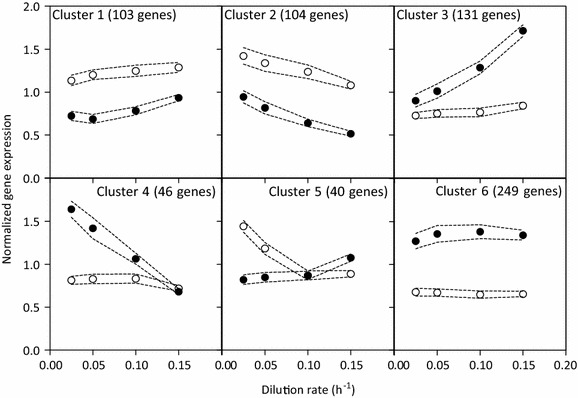
K-mean clustering of the 673 genes with differential expression profiles between FS09322 and CEN.PK113-7D. The data results from a dilution range of independent chemostat cultures (q-value for differential expression profiles below 0.005, see "Methods" section). For each cluster, the averaged normalized expression values are depicted for the resveratrol producing S. cerevisiae FS09322 (black circles) and for its congenic reference strain CEN.PK113-7D (open symbols) for the different dilution rates. The grey dotted lines exhibit the average standard error of these values