Fig. 3.

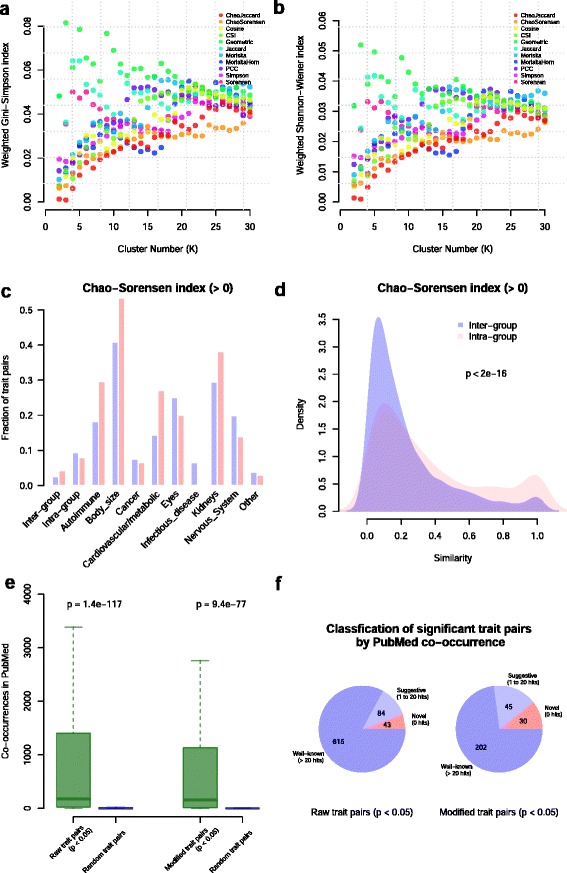
Entropy-based comparisons of similarity indices and computational validation of CPAG clusters. a Weighted heterogeneity versus cluster number using the Gini–Simpson index. We calculated weighted heterogeneity using equation , which can be interpreted as average heterogeneity per cluster per disease. The weighted heterogeneity captures variation of both cluster size and heterogeneity. b Weighted heterogeneity versus cluster number using Shannon–Wiener entropy index. Either entropy index indicates the Chao–Sorenson index results in the largest and least heterogeneous clusters based on the nine pre-defined trait categories. c The fraction of trait pairs with similarity > 0 for raw traits (blue) and modified traits (pink) is greater within pre-defined categories (Intra-group) than between categories (Inter-group). The fractions vary across different trait groups, indicating greater similarity among some groups of traits compared with others. d Distribution of non-zero similarity values for inter-group and intra-group for raw traits shows greater similarity for comparisons within pre-defined groups. The p value was calculated using Kolmogorov-Smirnov test. e Published literature supports the association of pairwise traits identified by CPAG. We searched PubMed using each trait pair and recorded the number of co-occurrences in titles and abstracts. The box plots represent the distribution of co-occurrences for raw or modified significant trait pairs compared with the co-occurrence distributions of 10,000 random trait pairs. We found significantly lower co-occurrences for both raw and modified traits based on the Mann–Whitney rank sum test. f CPAG reveals both well-established and novel trait pairs. The pie charts represent the fractions of trait pairs for three different categories: novel trait pairs with no co-occurrences in PubMed, suggestive trait pairs with co-occurrences between 1 and 20, and well-known trait pairs with >20 co-occurrences. The number of trait pairs within each category is given within each pie segment. Lists of potentially novel trait pairs are provided in Additional files 19 and 20. PCC Pearson correlation coefficient
