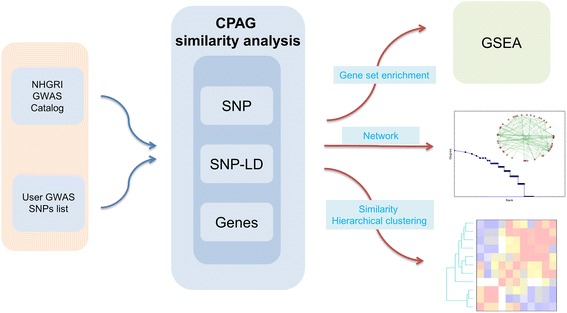
Fig. 6.

CPAG software. Workflow depicting how CPAG software detects trait similarity and provides a means for visualizing and mining similarity for hypothesis generation. User-generated lists of SNPs are used as input to make comparisons with the entire NHGRI GWAS Catalog based on SNPs, LD-corrected SNPs, or genes. In addition to a text read-out of similarity that includes a description of the SNPs, strength and significance of similarity, and GSEA of pathways underlying the similarity, results can be visualized by hierarchical clustering or by networks. CPAG software can be downloaded at [36]
