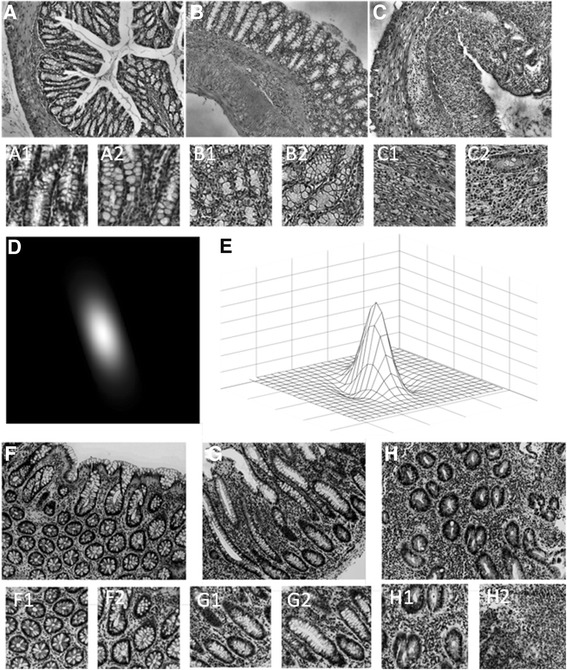
Fig. 1.

Examples of typical analyzed images representing whole range of tissue patterns: healthy control (a–mice; f–human) on the left; chronic inflammation (b–mice; g–human) in the middle and acute inflammation (c–mice; h–human) in the right. Examples of image cutouts used for analysis are below the whole sample images (from A1 to H2). Graph (e) and image of typical Gabor function (d) in the middle row
