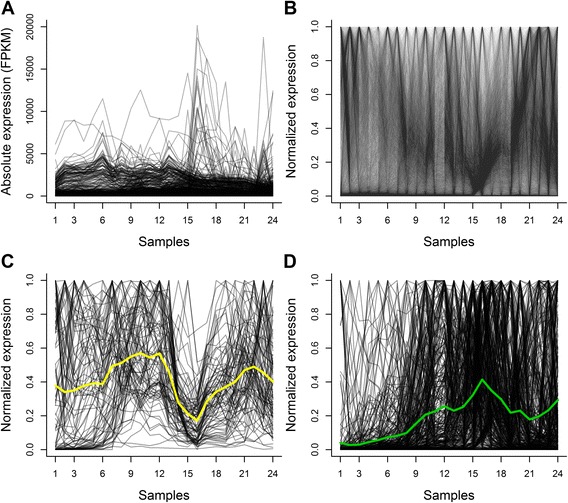
Fig. 1.

Transcription profiles of the Drosophila genes to be classified and of the training set. a–b Temporal expression profiles of the 13,642 Drosophila genes that show transcription level above zero in at least one sample during embryonic, larval or pupal stages. Graphs were constructed with absolute values (FPKM, a) and with the same values after normalization between 0 and 1 (b, see Methods). c Transcription profiles of the 92 “synaptic genes” of the training set after normalization of the original values between 1 and 0. A clear correspondence is observed between what is expected for the mean transcription profile of Drosophila synaptic genes and the actual expression profiles of the genes of our training set. Along the life cycle of Drosophila a first wave of massive synaptogenesis takes place during the second half of embryonic life (samples 7–12), and a second wave occurs in the pupa (samples 19–24), when the synapses of the adult brain are being formed. Between these two waves of synaptogenesis a period of massive synapse disassembly takes place. The yellow line corresponds to the mean expression levels of the 92 synaptic genes and matches these three features. d Transcription profiles of the 397 “non-synaptic genes” of the training set, after normalization of the original values between 1 and 0. The green line corresponds to the mean expression levels of the 397 non-synaptic genes. (Original values published by Graveley et al. [32] and adapted as explained in Methods)
