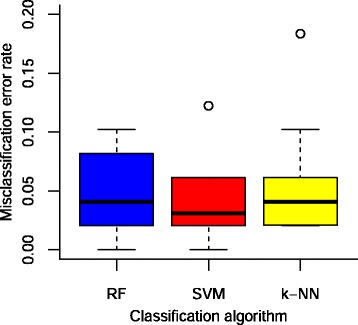
Fig. 2.

Misclassification error rates of the three adjusted models after 10-fold cross validation. Box plots of misclassification error rates of the three adjusted models: Random Forest (RF), Support Vector Machine (SVM) and k-Nearest Neighbors (k-NN), estimated by 10-fold cross validation as described in the text. In each box plot the black horizontal line represents the median value and the points outside the box correspond to values over or lower to 1.5 times interquartile range than the third or first quartile respectively
