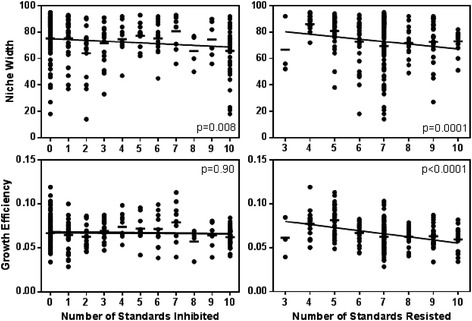
Fig. 3.

Relationships between cumulative inhibition (left panels) and resistance (right panels) phenotypes with niche width (top panels) and growth efficiency (bottom panels) among Streptomyces isolates. Spearman’s correlation coefficients and p-values are presented for relationships in each panel. Bars represent mean growth efficiency or niche width in each category
