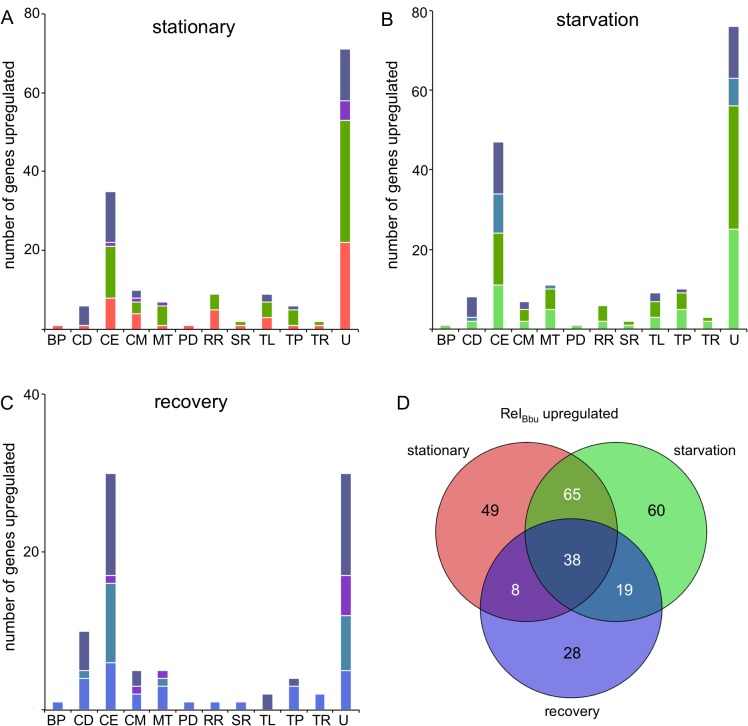
Fig 9. RelBbu-upregulated genes during nutrient stress.
The number of genes significantly RelBbu-upregulated (higher in wild type than rel Bbu -) greater than twofold as determined by RNA-seq in (A) stationary phase, (B) starvation and (C) recovery from starvation. Bars are color-coded based on the color scheme assigned in (D) for unique and overlapping conditions that upregulate genes. (D) Venn diagram of the number of genes RelBbu-upregulated in stationary phase, starvation and recovery from starvation. Functional gene category abbreviations are the same as in Fig 8.

