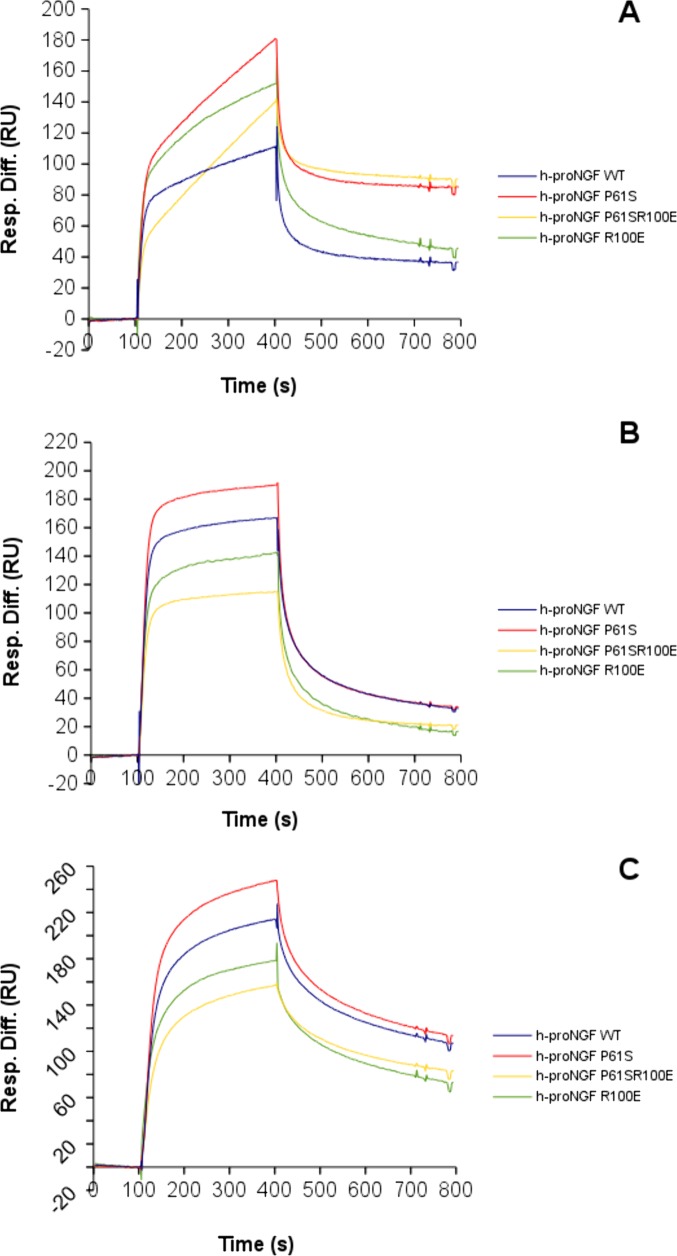
Fig 9. SPR kinetic analysis of NGF and mutants.
SPR kinetic analysis of binding of hproNGF WT (blue), hproNGF P61S (red), hproNGF P61SR100E (yellow), hproNGF R100E (green) over the anti-NGF antibodies R&D MAB 256 (panel A), αD11 (panel B), and the anti-proNGF antibodies Millipore clone EP1318Y (panel C). For each panel, the displayed curves correspond to the higher concentration of the analyte, both for hproNGF WT and mutants, in order to compare the proneurotrophins on the same antibody. The detailed SPR kinetics are shown in the S3–S5 Figs.

