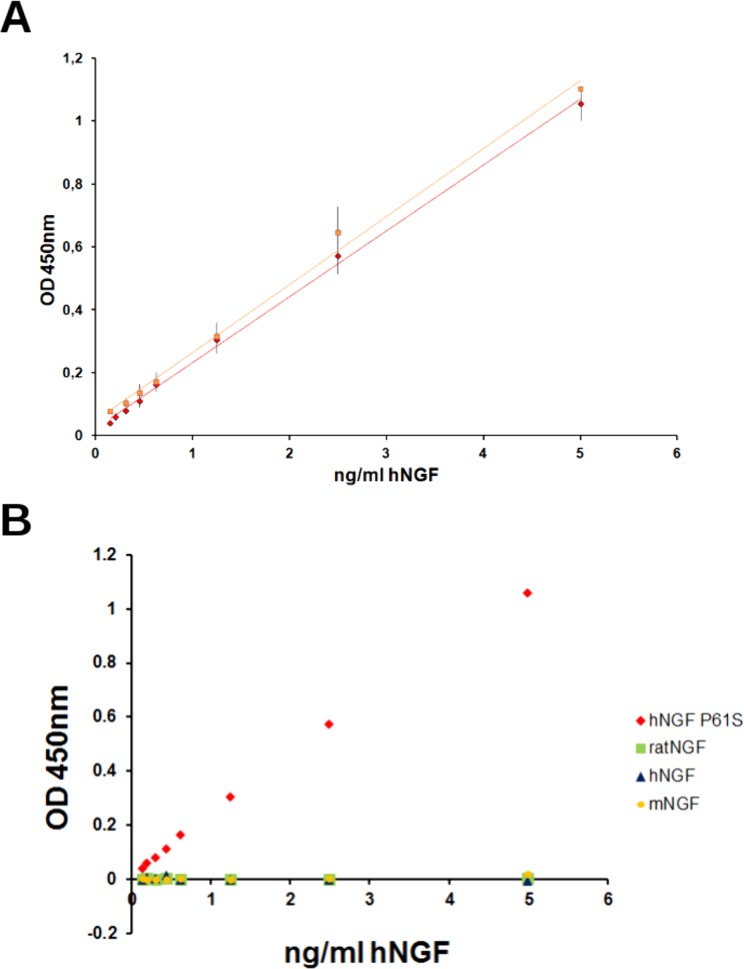
Fig 10. ELISA assay to measure hNGF P61S tagged mutants.
Panel A. Standard calibration curve, obtained with hNGF P61S (red diamonds) or hNGF P61SR100E (orange squares). Panel B. Calibration curves carried out with hNGF P61S (red diamonds), rat NGF (green squares), mouse NGF (yellow circles) and hNGF WT (blue triangles). The experimental points are the mean values of the different experiments, the error bars represent the standard deviations.

