
Fig. 1.
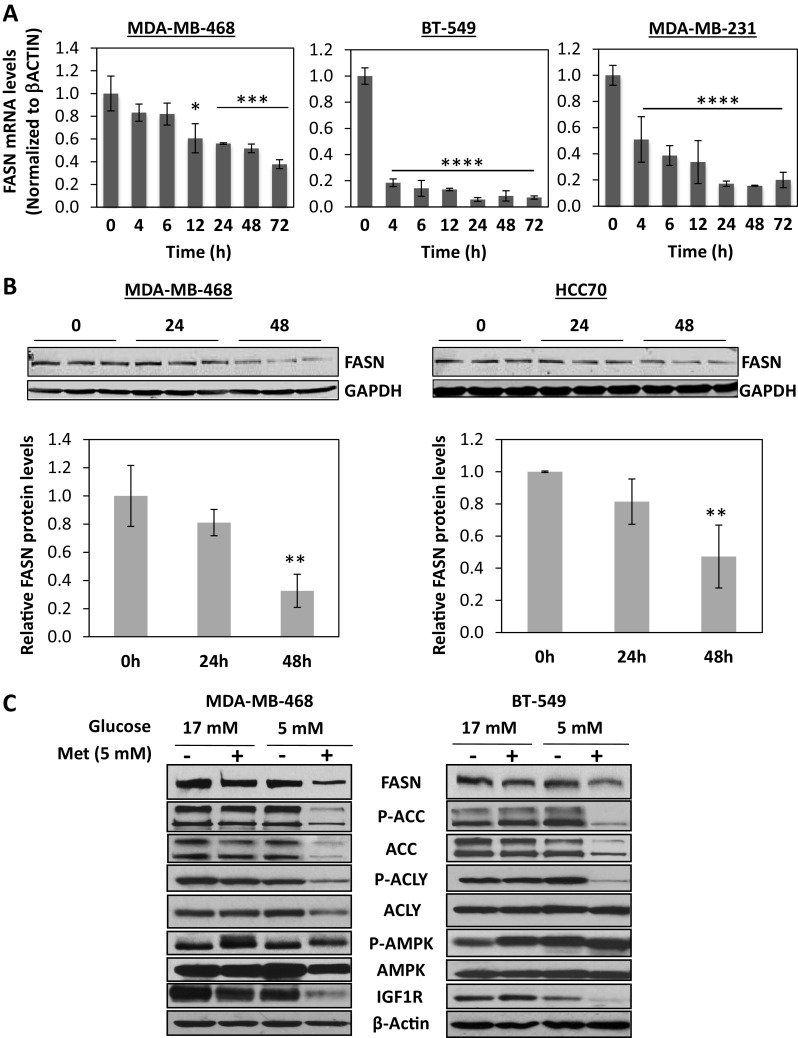
Metformin decreases FASN mRNA and protein in TNBC cell lines. a MDA-MB-468, BT-549, and MDA-MB-231 cells were treated with either 5 mM (BT-549 and MDA-MB-468) or 10 mM (MDA-MB-231) metformin for 0–72 h in 5 mM glucose, and qRT-pCR for FASN was performed. Shown are the averages of triplicate values, normalized to β-actin expression. *P < 0.01, ***P < 0.001, ****P < 0.0001, ANOVA with Tukey’s multiple comparisons test. b TN cell lines (HCC70 and MDA-MB-468) were plated in media containing 10 % FBS and changed to media with 5 % FBS, 5 mM glucose the next day. After 24 h, 10 mM metformin was added and cells harvested 24 and 48 h later. Immunoblots were probed for FASN protein. Blots were scanned, quantitated using an Odyssey infrared imager, and normalized to GAPDH (bottom). **P < 0.01, ANOVA with Tukey’s multiple comparisons test. c MDA-MB-468 cells were glucose starved for 24 h, then replenished with media containing 5 or 17 mM glucose for 24 h and treated with or without 5 mM metformin for 24 h. Whole-cell protein extracts were prepared and the level of FASN, P-ACC, ACC, P-ACLY, ACLY, P-AMPK, AMPK, IGFIR, and β-actin determined by immunoblot analysis. Experiments are representative of three individual experiments