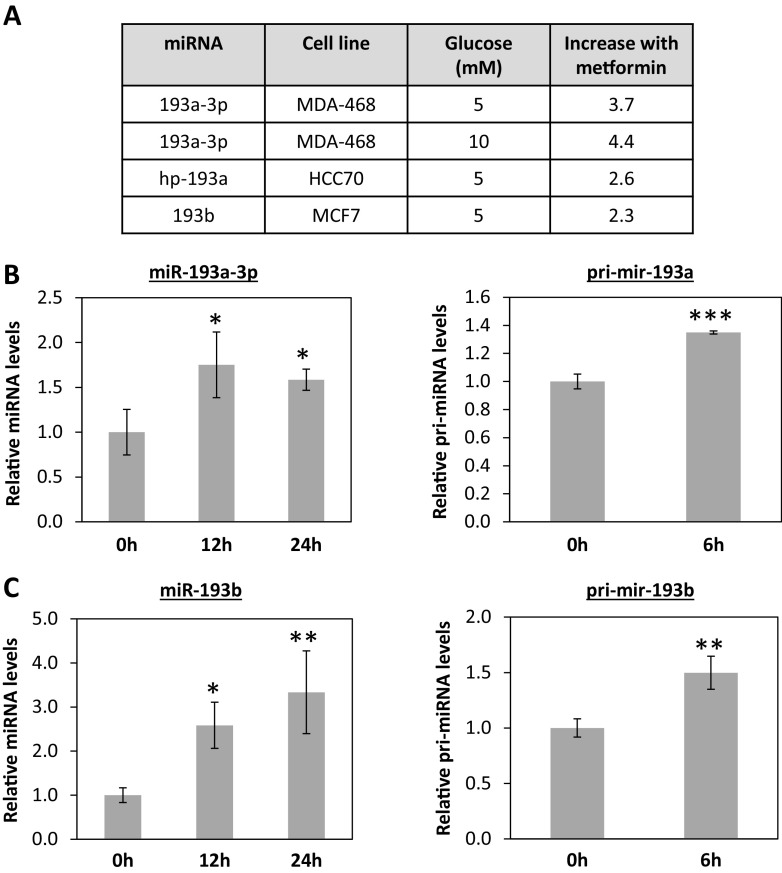
Fig. 2.
Metformin upregulates miR-193 family members in TNBC cells. Cells were plated in media containing 10 % FBS and changed to media with 5 % FBS, 5 or 10 mM glucose the next day. After 24 h, 10 mM metformin was added to plates (n = 3) for 6 h prior to harvesting RNA. miRNA expression profiling was performed on Affymetrix miRNA 2.0 chips. a Table showing fold change with P ≤ 0.05 for miR-193 family members in TN cell lines. Taqman qRT-PCR for mature miR-193a-3p (b, left) and the primary transcript (b, right) and mature miR-193b (c, left) and primary transcript (c, right) for MDA-MB-468-treated cells. For miRNA transcript quantification, *P < 0.05, **P < 0.01, ANOVA with Tukey’s multiple comparisons test. For primiRNA quantification, **P < 0.01, ***P < 0.001, unpaired t test

