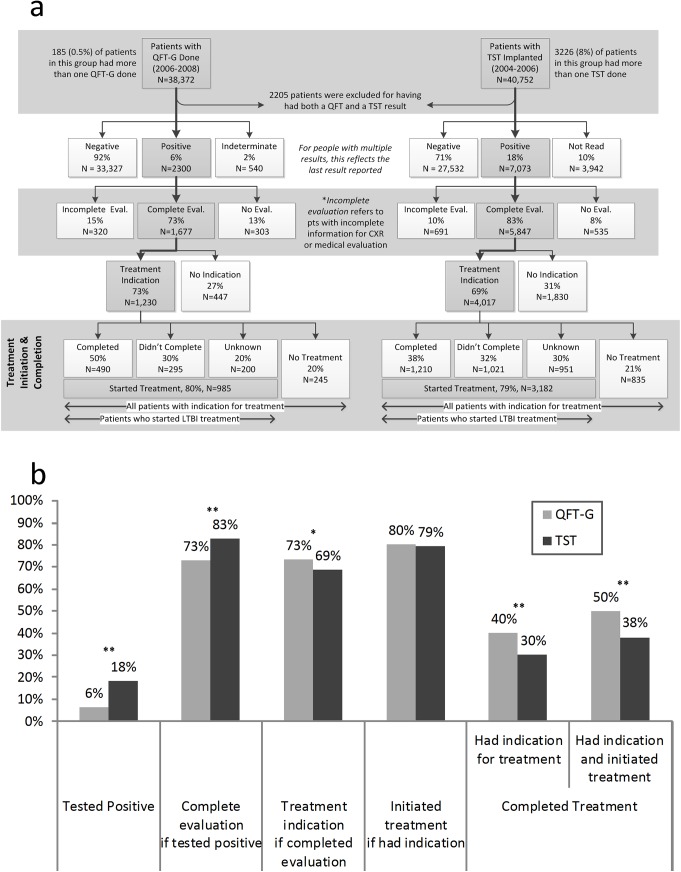
Fig 1. From testing to treating LTBI in New York City Department of Health and Mental Hygiene chest clinics by QFT-G (2006–2008) or TST (2004–2006).
(a). Flowchart representing the flow of patients from testing to treatment for LTBI in the utilization periods (QFT-G and TST). Complete Evaluation: evaluation by a physician and had a chest radiograph. Incomplete Evaluation: patients who were evaluated by a physician or had a chest radiograph but not both. LTBI Treatment Completion: 9 months of isoniazid or completion of an alternative regimen, per ATS/CDC and NYC DOHMH guidelines at that time. (b) Comparison of final LTBI test results, treatment initiation, and treatment outcomes between the utilization periods (QFT-G and TST). The bars represent (from left to right) the percentage of patients who tested positive for LTBI; of patients who tested positive, the percentage evaluated for LTBI treatment; of those evaluated, the percentage that had an indication for treatment; percentage of patients with treatment indication who initiated treatment for LTBI; percentage that completed treatment for LTBI among those who had an indication, and the percentage that completed treatment among all those with an indication for treatment who started treatment. [*] P<0.001, [**] P<0.0001

