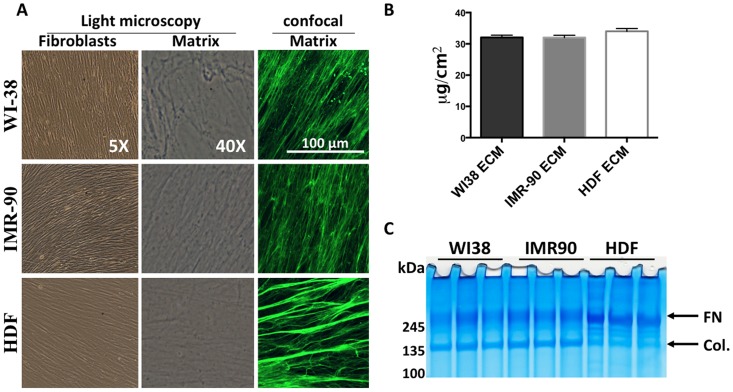
Fig 1. Characterization of fibroblasts and their ECM.
A. Microscopic analysis of fibroblasts and de-cellularized matrix. Left colum- 5X phase contrast imaging of confluent fibroblasts just prior to de-cellularazation. Middle colum- 40X phase contrast microscopy of ECM following decellularization. Right column- Immunofluorescent confocal microscopy of fibroblast-derived ECM using an NHS-ester probe conjugated to Alexa Fluor 488. (B) Protein content of ECM was quantitated after scraping of the ECM from decellularized plates. Protein amount is indicated a μg/cm2, N = 3. (C) SDS-PAGE and colloidal blue stain of fibroblast-derived ECM. n = 3.

