
Fig 2. Representative CT images obtained from a 46 year-old male patient.
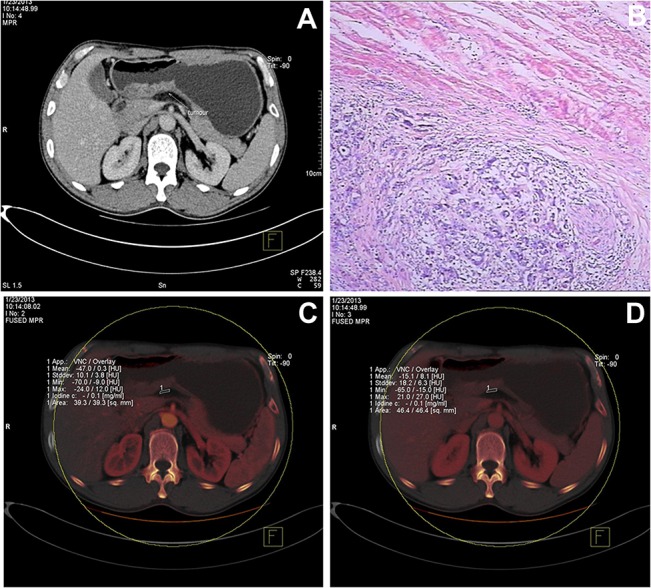
(A) The mixed venous phase image depicts thickening of the wall of the antrum with transmural enhancement. The density of the perigastric fat was elevated, with a stripe-like shadow. The clinical stage was determined to be cT4. (B) The histological image, stained with hematoxylin and eosin (HE, ×100), revealed a grade II adenocarcinoma with muscularis invasion. The pathologic stage was pT3. (C) The iodine map at the arterial phase shows that the iodine concentration was 0.1 mg/mL in the perigastric fat (ROI 1). (D) The iodine map at the venous phase shows that the iodine concentration was 0.1 mg/mL in the perigastric fat (ROI 1).