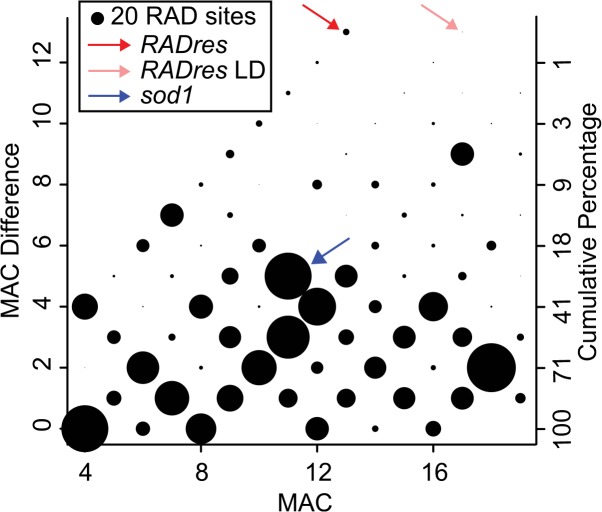
Fig 1. Distribution of allele frequencies among RAD sites.
We characterized 1611 informative RAD sites in 19 inbred lines by minor allele count (“MAC”) (maximum of 19; i.e. 50% allele frequency) and difference in MAC between susceptible (N = 10) and resistant (N = 9) lines (“MAC difference”, theoretical maximum = 18; i.e. 9 resistant lines fixed for one allele, 10 susceptible lines fixed for another). Circle sizes are proportional to the number of RAD sites showing each pattern. The cumulative percentage of RAD sites, starting with the highest observed MAC difference, is shown on the righthand y-axis. The highest MAC difference was observed for 10 RAD sites in perfect mutual LD, with a MAC of 13 and a MAC difference of 13, which we defined as the RADres region and examined further (red arrow; encompasses scaffolds of subsequently examined markers RADres1 and RADres2). The one remaining RAD site with an equivalent MAC difference was also in high, but not perfect, LD with RADres (pink arrow; scaffold not examined further). The sod1 haplotype block had a MAC difference of 5, which was higher than average but not an outlier (blue arrow).

