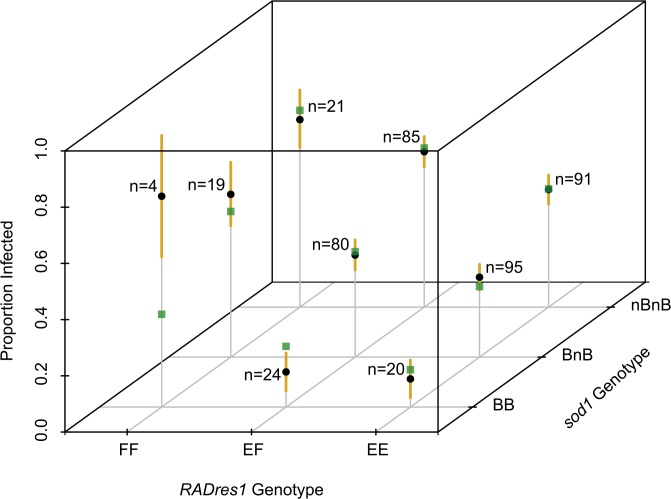
Fig 6. Joint influence of RADres1 and sod1 genotypes on resistance.
Genotype combinations are indicated along the x and y axes. Empirical resistance values are plotted as black circles along the z axis. Standard errors of proportions for resistance at each genotype combination are shown with a vertical yellow line. Predicted values from an additive 2-locus multiple regression model with no dominance or epistasis are indicated with green squares. The data are consistent with this simple model, although minor non-additive effects may be responsible for small nonsignificant differences between predicted and empirical values.

