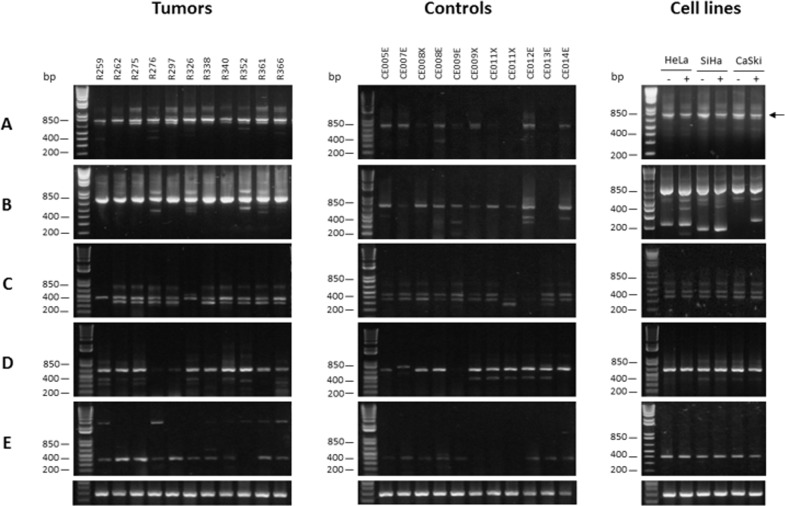
Fig 6. Analysis of CDKN3 transcripts.
Figure shows gel electrophoresis of mRNA variants of CDKN3 gene identified in CC, controls, and cell lines using reverse transcription-polymerase chain reaction (RT-PCR). Panel A and B show wild-type (wt) CDKN3 mRNA transcript. (A) RT-PCR was performed with external primers F1/R1 (756 bp, black arrow). (B) A 2-μL sample of 1:5 dilution of reactions of (A) were re-amplified using the nested primers F2/R5. In some samples, other weak transcripts were observed below wtCDKN3 transcript (721 bp) including variants cx1, cx2, cx3, cx4, and cx5 (200, < 200, 400, 450, and 500 bp, respectively). (C) RT-PCR identified the “f” variant (453 bp) using primers F1/R9f. Most samples showed an additional lower band (cx6 variant, 370 bp). (D) RT-PCR identified “i” variant (633 bp) using primers F6i/R5. (E) RT-PCR identified “k” variant (392 bp) using primers F4/R5. Lower panel shows RT-PCR amplification of glyceraldehyde 3-phosphate dehydrogenase (GAPDH) gene as internal control. Cell lines were transfected with random siRNAs (-) or specific CDKN3 siRNAs (+), treated, and then incubated as described in Material and methods. RT-PCR was performed on RNAs extracted 48 h after transfections.

