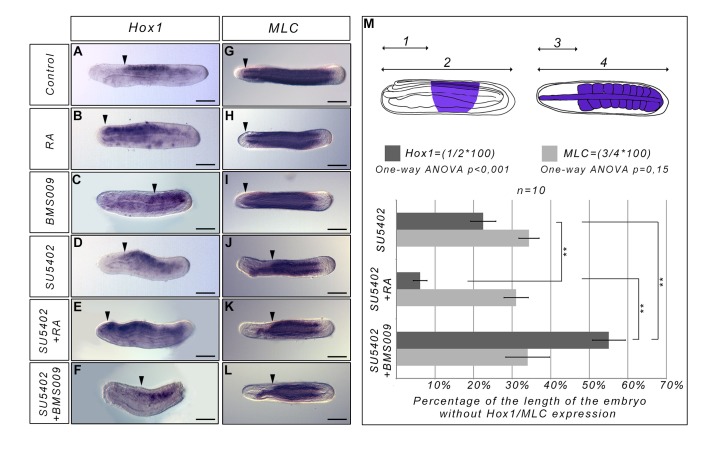
Fig 1. The anterior limit of Hox1 expression does not define a functional boundary between anterior FGF-sensitive and posterior FGF-insensitive somites.
Expression of Hox1 (lateral views, anterior to the left) and MLC (dorsal views, anterior to the left) at the L0 stage in control embryos (A, G), in RA treated embryos (B, H), in BMS009 treated embryos (C, I), in SU5402 treated embryos (D, J), in SU5402 and RA treated embryos (E, K) and in SU5402 and BMS009 treated embryos (F, L). All the treatments were performed at the blastula stage. The arrowheads indicate the anterior limit of Hox1 expression (A-F) or the anterior limit of the embryonic region with formed somites (G-L). (M) Graph presenting the percentage of the length of the embryo without Hox1 expression (dark grey) or without somites in the anterior region (light grey). The schematic embryos show how this percentage was calculated. (1) corresponds to the length of the anterior region without Hox1 expression, (2) corresponds to the total length of the embryo. (3) corresponds to the length of the anterior region without somite MLC expression. (4) corresponds to the total length of the embryo. Dark blue regions in the schematic embryos correspond to the territories expressing Hox1 (lateral view, anterior to the left) or MLC (dorsal view, anterior to the left) in SU5402 treated embryos. A one-way ANOVA analysis was undertaken and the result indicates that the means of the region without somites is not significantly different between the three treatments (SU5402, SU5402+RA and SU5402+BMS009) whereas the means of the region without Hox1 expression is significantly different between the three treatment conditions (SU5402, SU5402+RA and SU5402+BMS009). **P<0.003 (corrected p-value); Two samples Student t-test, n = 10 embryos. Error bars indicate s.e.m. Scale bars = 50μm.

