
Fig. 2.
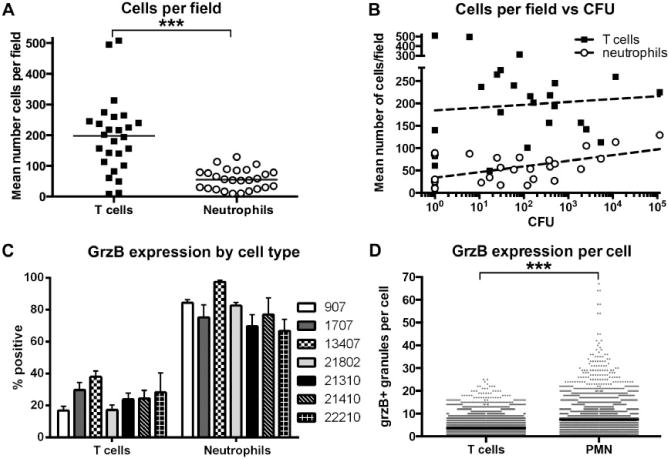
Frequency and relative quantification of grzB expression by T cells and neutrophils.
A. Granuloma fields imaged at 40× contained significantly more T cells than neutrophils. Each point represents one granuloma, n = 12 monkeys, ***P < 0.0001; Mann–Whitney test, bar represents the median.
B. Numbers of neutrophils in granulomas correlate with bacterial load per granuloma, while T-cell numbers do not. Each point represents one granuloma, n = 12 monkeys.
C. As a percent of the total population, more neutrophils than T cells express grzB in granulomas. Bars represent the mean with SEM of images from two to four granulomas per animal (monkey ID numbers indicated to the right of the graph).
D. On a per cell basis, granuloma neutrophils contain more grzB+ granules per cell than T cells. n = 4627 neutrophils and 10 722 T cells, ***P < 0.0001, Mann–Whitney test, bar represents the median.