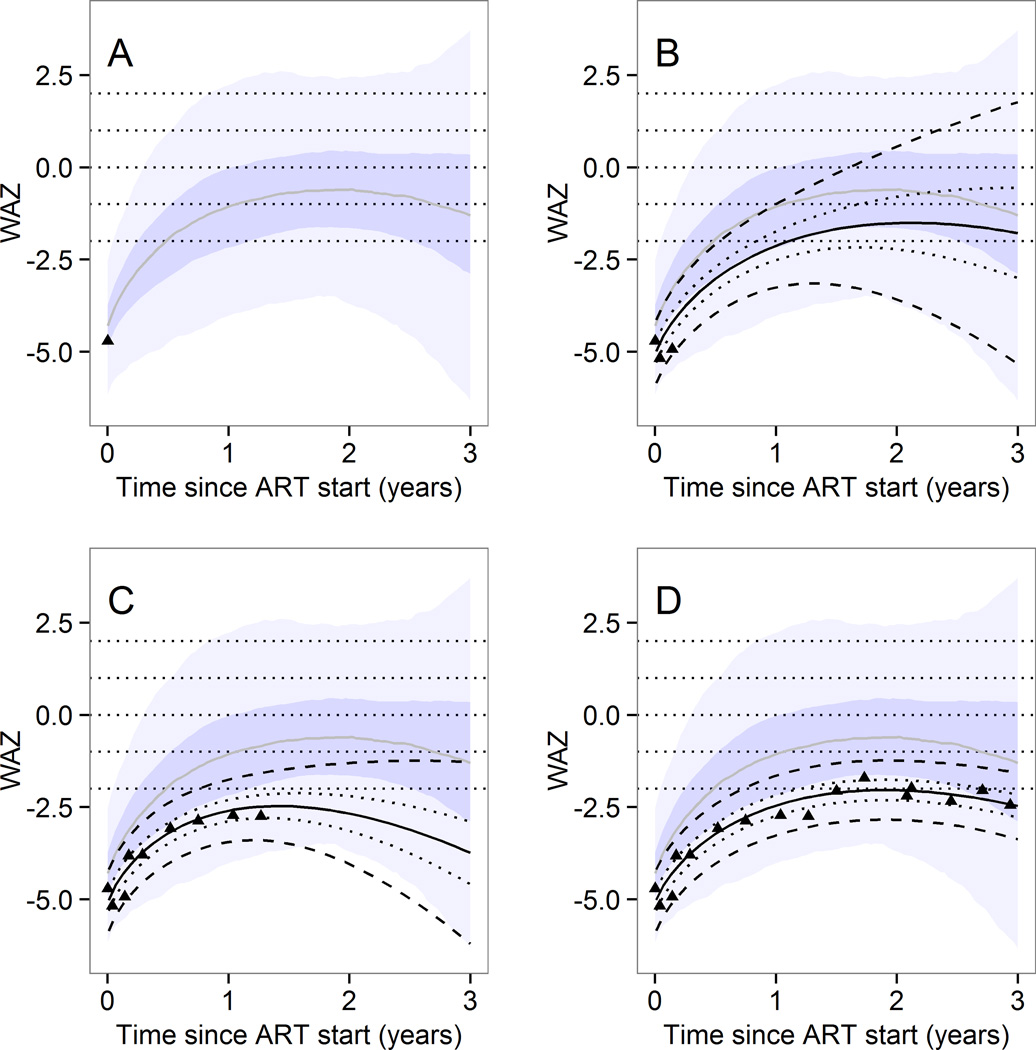
Figure 3.
Illustration of the web-interface - example of individual predictions of weight for age growth trajectory.
Predictions up to 3 years after start of antiretroviral therapy can be made according to the characteristics of the child at start of antiretroviral therapy and weight measurements thereafter. Predictions are based on predictive distributions from the Bayesian multilevel model.
The example shows the actual measured values for one particular child with a baseline age of 2 to 5 years and a baseline weight for age z score
< −3. Observed values (dots) and prediction intervals (median, 50% and 95%) for that child are shown. The shaded area shows the prediction intervals for any child with the same baseline age and z-scores. The predictions for a particular child are adjusted each time more values are entered.
In panel A, only the first weight measurement was available and population-level prediction intervals are shown. In panel B, three weight measurements were available and an individual-level prediction (black) is shown on top of the population-level predictions. In panel C, 9 measurements were available and in panel D all measurements are shown. The prediction intervals for that particular child are based on the known values shown as dots.
These predictions are implemented both for weight for age and height for age and can be accessed from the following webpage: http://growthapp.iedea-sa.org. The user can introduce his own values of interest and must then specify if the predictions are for a child from a cohort which was used to develop the model or if the child comes from an external cohort.

