


Figure 3.
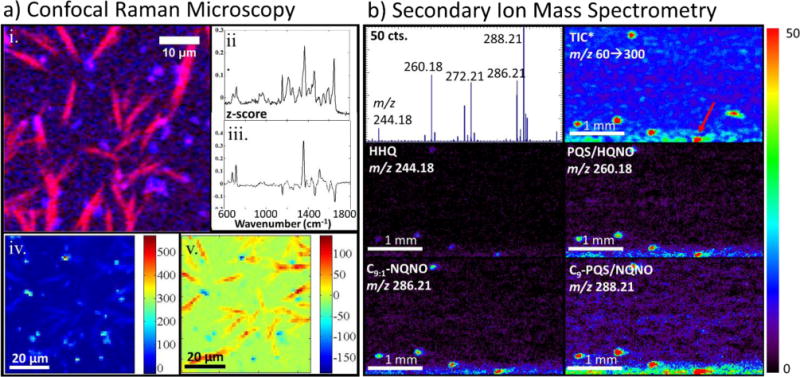
CRM (a) and targeted SIMS (b) imaging and microspectroscopy of a representitve region of a 48-hour P aeruginosa biofilm (a) (i) Composite Raman image acquired from the edge of a 48-h static biofilm constructed from images integrated over 1338–1376 cm−1 (pink) and 1638–1676 cm−1 (blue) show the co-location of two distinct chemical entities within the same region (ii) PC2 and (iii) PC3 contain features resembling bands of PQS and HQNO standards, respectively heat maps of PC2 (iv) and PC3 (v) (b) SIMS images at lower resolution reveal that the central regions of the 48-h films are mostly devoid of the high intensity regions, with the AQs primarily confined to the colony boundary The mass spectrum is an average of four pixels from a high-intensity region of the film (as indicated by the red arrow) The TIC images include values in the m/z 60–300 range, scaled from 0 to 2 counts, while the individual ion images are scaled as indicated by the color bar on the right.