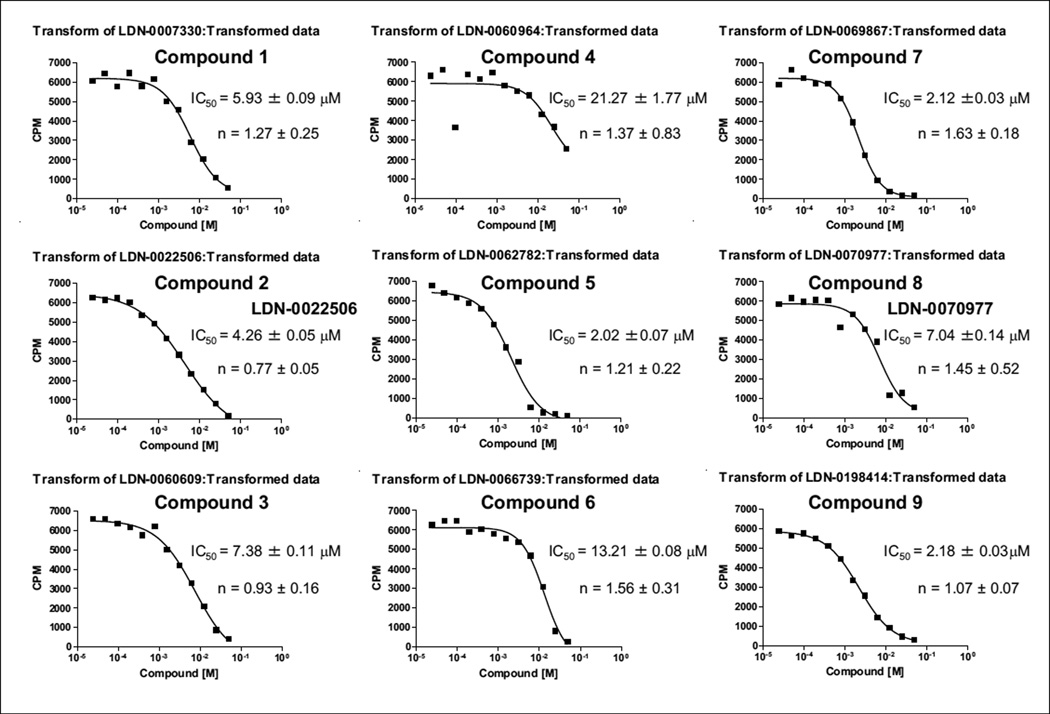
Figure 4.
Evaluation of compounds by radiometric assay. Compounds were evaluated at 1 µM eIF2α, 1 µM adenosine triphosphate (ATP), and 8 nM PERK. The IC50 for each compound was averaged from the three independent experiments, and one representative experiment is shown. The sigmoidal dose-response (variable slop) equation was used to obtain curve fits.

